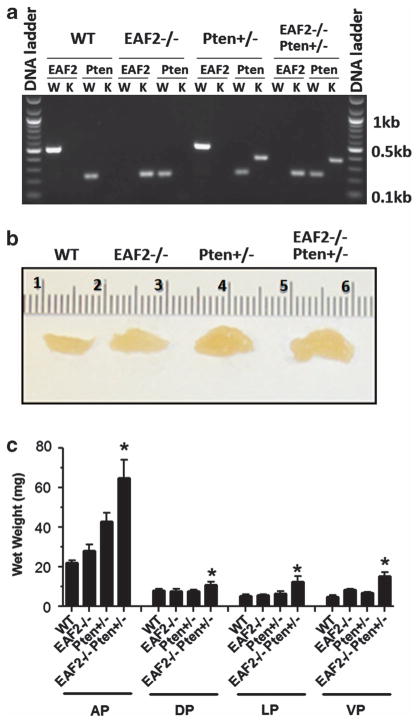
Figure 1.
Increased prostate growth in EAF2−/− Pten +/− mice. (a) Representative genotyping PCR results for each genotype. W, wild-type. K, knockout. (b) Representative morphology of 12-month-old mouse anterior prostate with indicated genotypes. (c) Wet weight of 12-month-old mouse prostates with indicated genotypes (nine mice per group). *P<0.05 compared with other groups.

