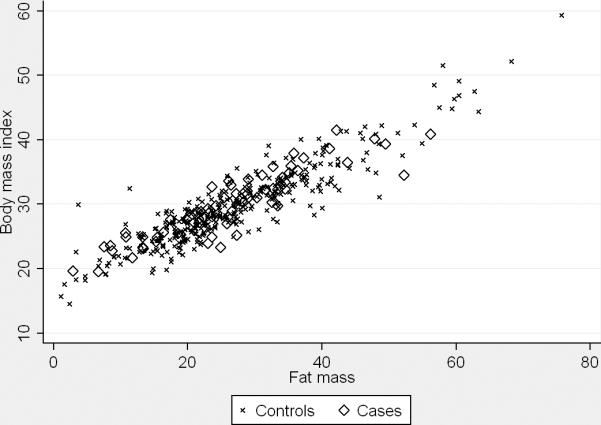
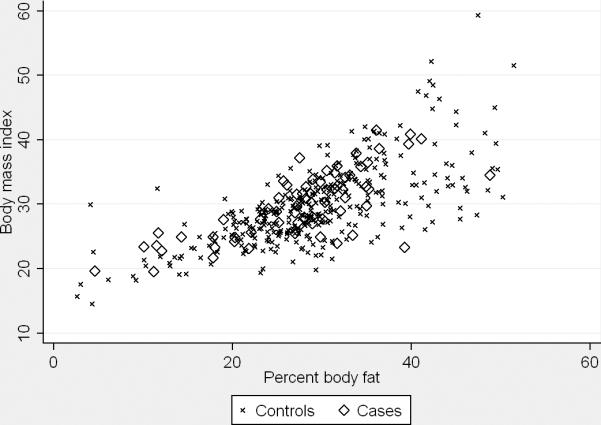
Figure 1.


Scatter plots show univariate correlations between body mass index and fat mass (left panel; All controls, Spearman's r=0.91, P<0.001; BE cases, r=0.90, P<0.001) and body mass index and total body fat percentage (right panel; All controls, r=0.70, P<0.001; BE cases, r=0.73, P<0.001), by case status.
