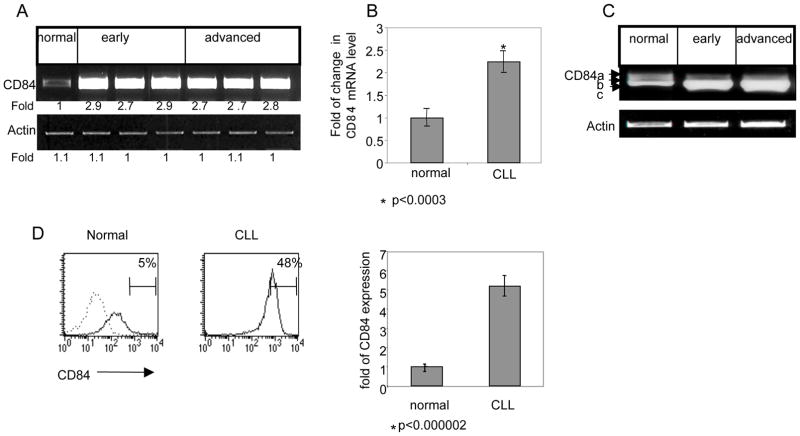
Figure 1.
Elevated expression of CD84 in CLL cells. B cells derived from healthy subjects (normal), as well as early- and advanced-stage CLL patients were purified and examined for CD84 expression. (A) CD84 and actin mRNA were analyzed by RT-PCR. The results presented are representative of two normal, six early-stage, and six advanced-stage CLL patients. (B) Quantitative Real Time PCR (qPCR) was performed using primers for CD84 and RP-2. Results are expressed as a fold of change in CD84 mRNA in CLL cells compared to normal B cells, which was defined as 1. The graph summarizes results of three normal and seven CLL patients. (C) Expression of several CD84 isoforms and actin mRNA were analyzed by RT-PCR, as described in Methods. The results presented are representative of three normal, six early-stage, and five advanced-stage CLL patients. (D) Cells were stained with anti-CD84 followed by a secondary (goat anti-mouse) antibody. Histograms show CD84 expression (grey line) or staining with secondary Ab alone (dotted line) in normal B and CLL cells. The graph summarizes the results of two normal and 18 CLL patients.

