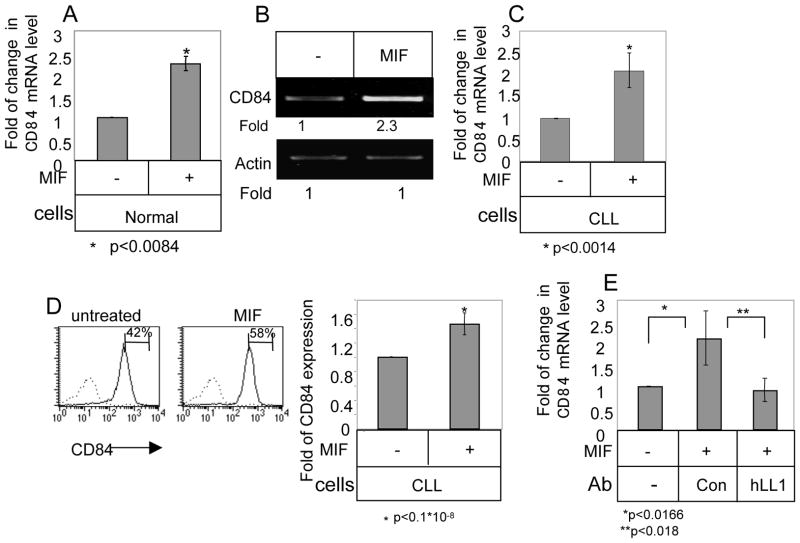
Figure 2.
CD84 expression is elevated in CLL cells in a MIF/CD74 dependent manner. (A) Normal B cells were purified and incubated in the presence or absence of MIF (100 ng/ml). After 18 h, RNA was purified and Quantitative Real Time PCR was performed using primers for CD84 and RP-2. Results are expressed as fold of change in CD84 expression following MIF stimulation; untreated cells were defined as 1. The graph summarizes results of B cells from two normal donors. (B–D) CLL cells were purified and incubated in the presence or absence of MIF. (B) After 18 h, RNA was purified, and CD84 and actin mRNA levels were analyzed by RT-PCR. The results presented are representative of nine CLL patients. (C) Following 18h, the RNA was purified, and qPCR was performed using primers for CD84 and RP-2. Results are expressed as fold of change in CD84 expression in MIF stimulated relative to untreated cells, which were defined as 1. The graph summarizes results of six CLL patients. (D) Following 24h, cells were stained with anti-CD84 followed by a secondary (goat anti-mouse) antibody. Histograms show CD84 expression (grey line) or secondary Ab (dotted line) on CLL cells. The graph summarizes results of 10 CLL patients. (E) CLL cells were incubated in the presence or absence of MIF (100 ng/ml), hLL-1 (50 μM) or an isotype control Ab (50 mM). Following 18 h, RNA was purified and qPCR was performed using primers for CD84 and RP-2. Results are expressed as a fold change in CD84 following the various treatments. Untreated cells were defined as 1. The graph summarizes results from three CLL patients.

