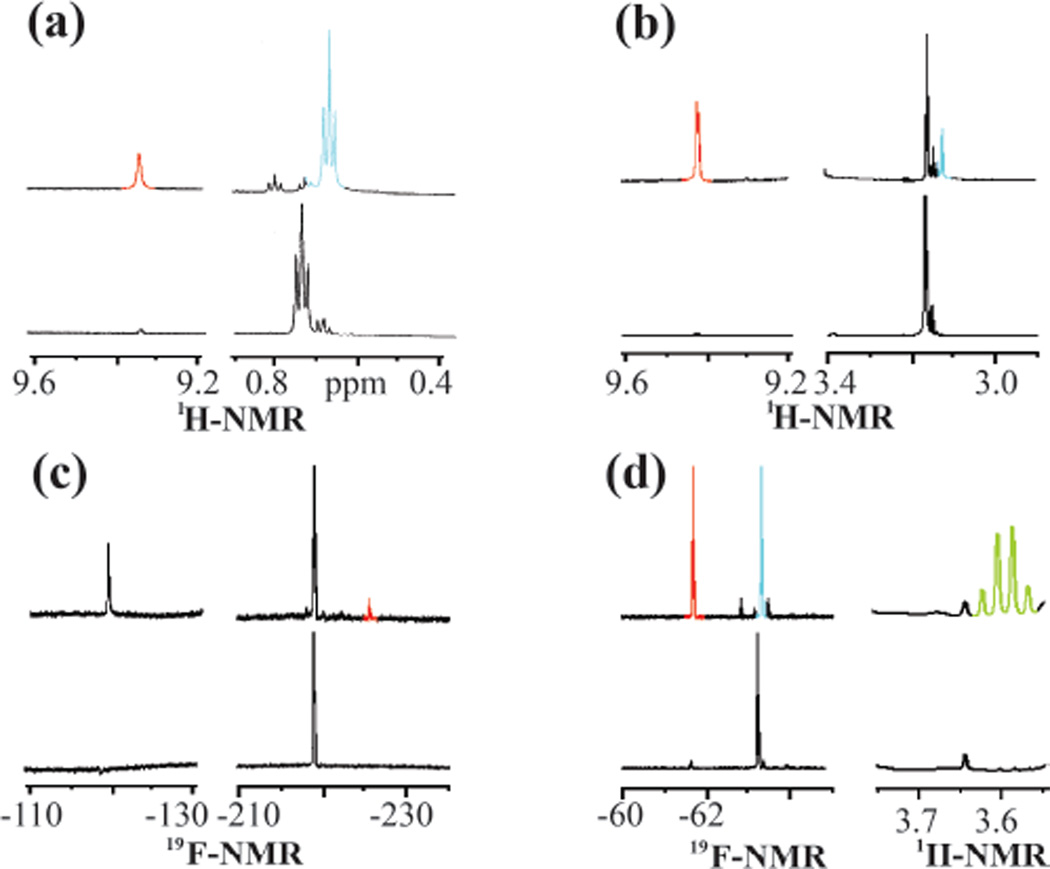
Figure 1.
Selected 1H and 19F NMR assays of HppE with substrate analogues: (a) 35, (b) 36, (c) 37, and (d) 38. The bottom trace of each panel is the spectrum taken 3 min after mixing HppE with the substrate analogue, and the top trace is recorded 27 min after initiation of the reaction. The NMR signals and the corresponding protons in the structures shown in Scheme 4 are colorcoded.

