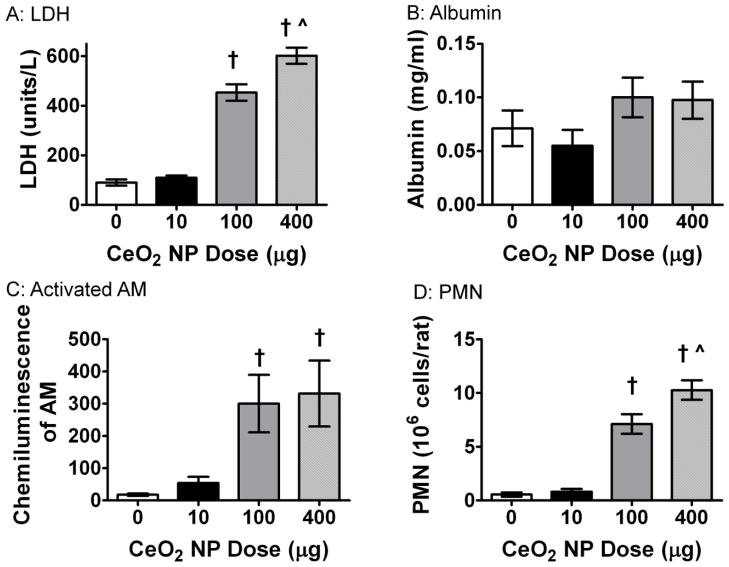
Figure 3.
Pulmonary inflammation was altered after exposure to CeO2 NPs. There was a significant increase in LDH (A), AM activation (C), and PNM inflitration (D). However, there was no change in albumin (B) levels after exposure. Values are means ± SE. † p ≤ 0.05 vs. control; ^ p ≤ 0.05 vs. 100 μg CeO2 NPs.

