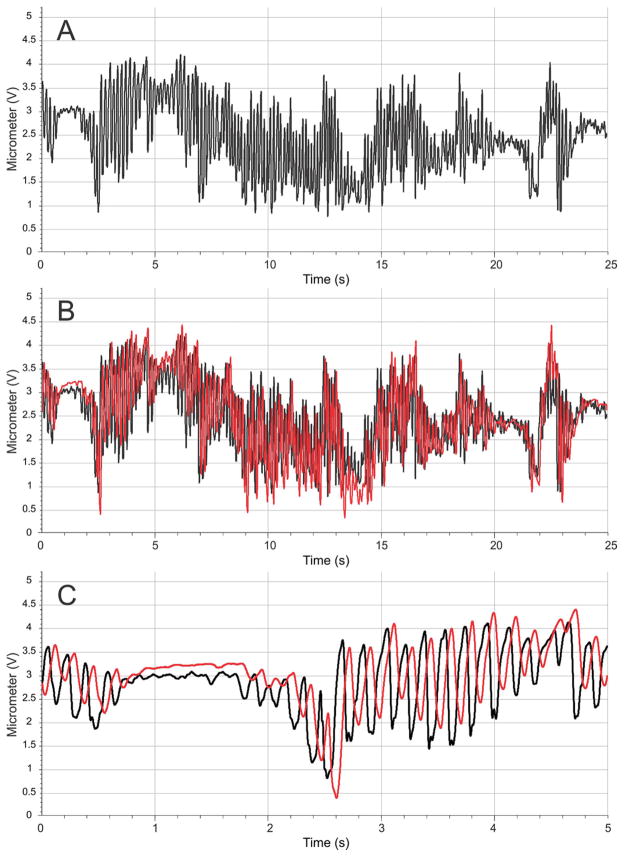
Figure 7.
Micrometer recording from the C1 whisker position for the healthy whisker pad (A) and the healthy pad with the yoked contralateral paralyzed whisker pad C1 movement overlaid in red (B). The first 5 seconds in plot A/B are expanded in the bottom panel (C), demonstrating the time lag and phase difference for the driven movement (in red) relative to the healthy, volitional movement (in black).

