Figure 1.

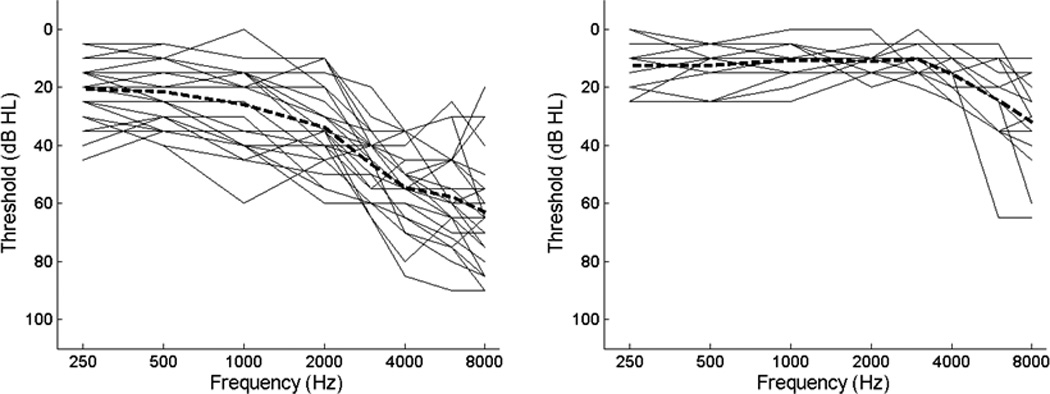
Audiograms (test ear) for listeners with hearing loss (left panel) and for the control group (right panel). Individual audiograms are plotted as thin solid lines. The thick dashed line shows the mean audiogram within each group.

Audiograms (test ear) for listeners with hearing loss (left panel) and for the control group (right panel). Individual audiograms are plotted as thin solid lines. The thick dashed line shows the mean audiogram within each group.