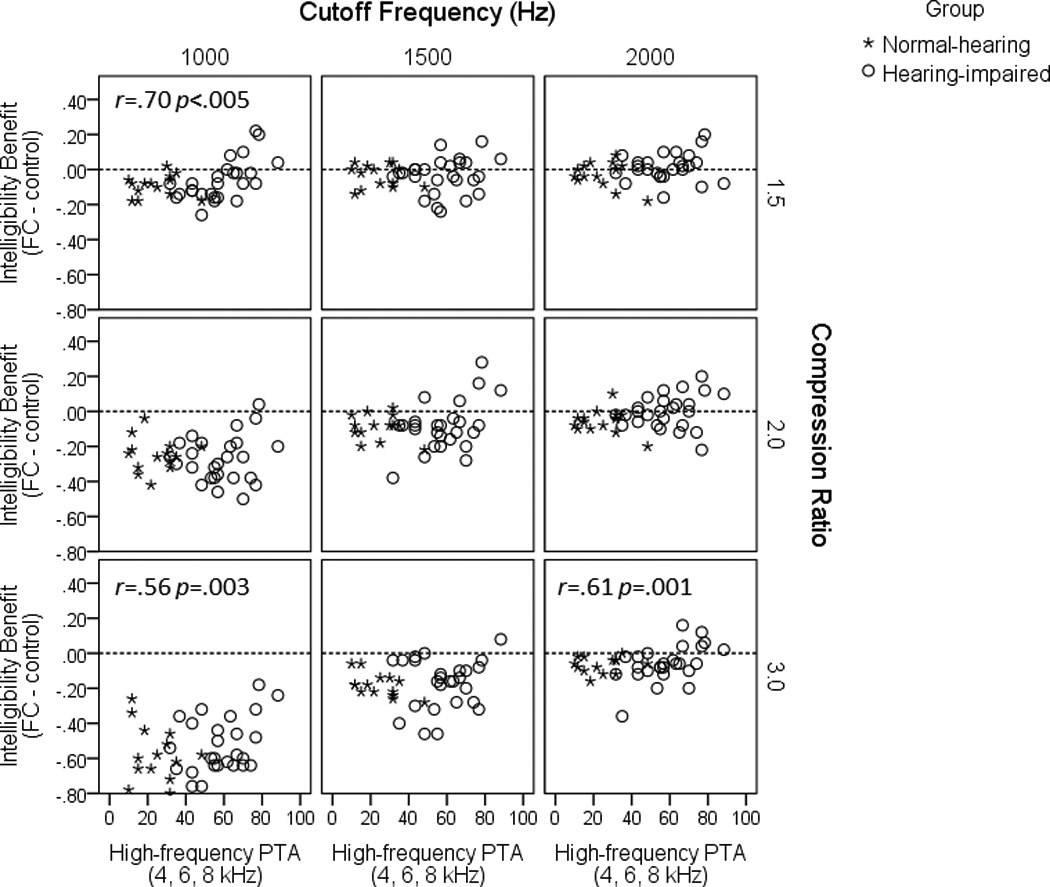
Figure 3.

Intelligibility benefit (calculated as intelligibility score with frequency lowering minus intelligibility score for the control condition) as a function of high-frequency thresholds (average of 4, 6 and 8 kHz) for each listener. Filled circles represent listeners in the hearing-impaired group and asterisks represent listeners in the control group. Values above the zero (dashed) line represent participants for whom frequency lowering improved sentence recognition over the control condition. Data shown are for +5 dB SNR.
