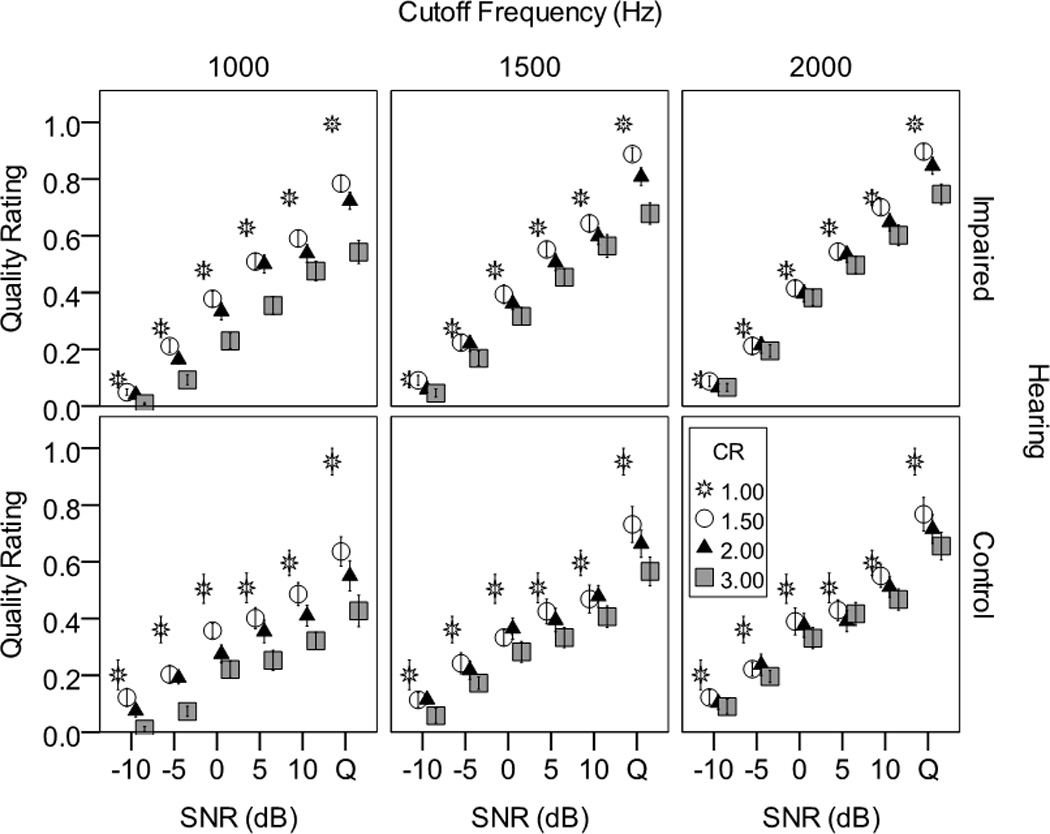
Figure 4.

Effect of frequency lowering on speech quality. Each panel shows normalized quality for a different cutoff frequency, as a function of signal-to-noise ratio (SNR; Q=quiet) and compression ratio. The control condition (no frequency lowering) is plotted in each panel as asterisks. Results for listeners with hearing loss are shown in the top panels and for the control group in the lower panels. Error bars show +/− one standard error about the mean.
