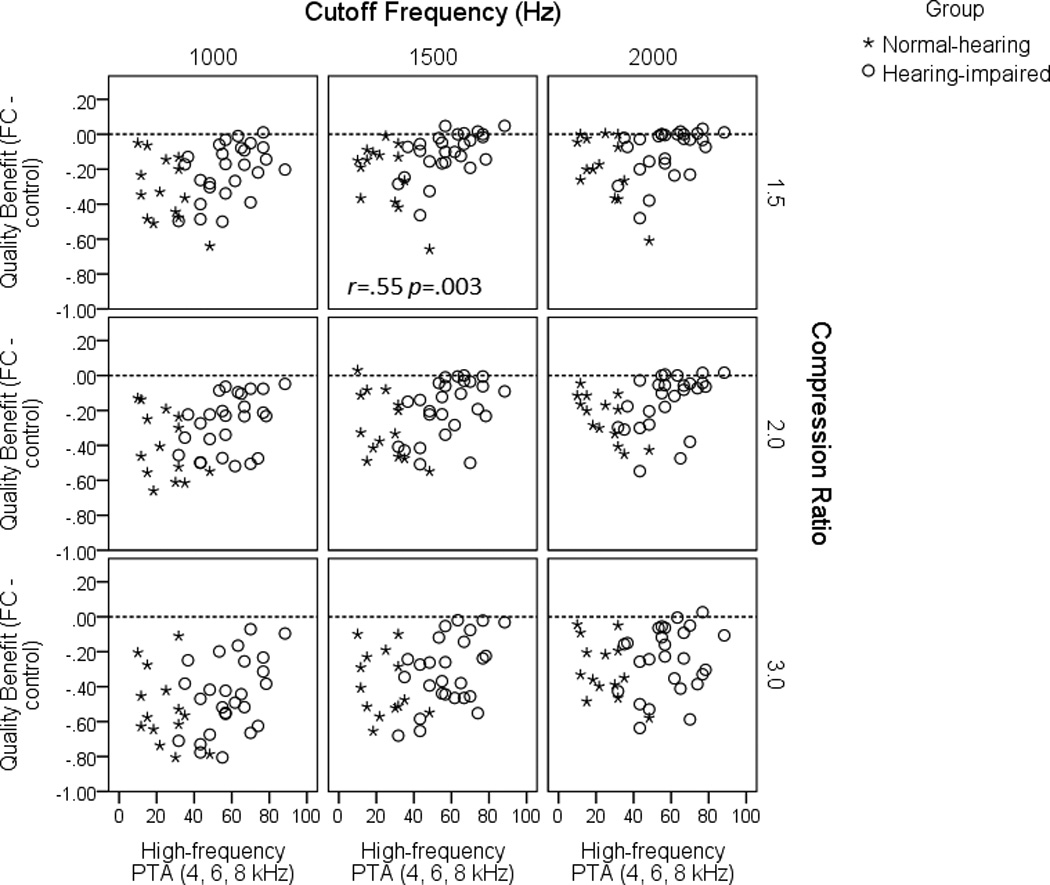
Figure 5.

Quality benefit (calculated as quality rating with frequency lowering minus quality rating for the control condition) as a function of high-frequency thresholds (average of 4, 6 and 8 kHz) for each listener. Values above the zero (dashed) line represent participants for whom frequency lowering improved sentence recognition over the control condition. Data shown are for quiet.
