Abstract
Since hyperglycemia aggravates acute pancreatitis and also activates the receptor for advanced glycation endproducts (RAGE) in other organs, we explored if RAGE is expressed in the pancreas and if its expression is regulated during acute pancreatitis and hyperglycemia. Acute pancreatitis was induced by cerulein in untreated and streptozotocin treated diabetic mice. Expression of RAGE was analyzed by Western blot and immunohistochemistry. To evaluate signal transduction the phosphorylation of ERK1/ERK2 was assessed by Western blot and the progression of acute pancreatitis was monitored by evaluation of lipase activity and the pancreas wet to dry weight ratio. RAGE is mainly expressed by acinar as well as interstitial cells in the pancreas. During acute pancreatitis infiltrating inflammatory cells also express RAGE. Using two distinct anti-RAGE antibodies six RAGE proteins with diverse molecular weight are detected in the pancreas, whereas just three distinct RAGE proteins are detected in the lung. Hyperglycemia, which aggravates acute pancreatitis, significantly reduces the production of two RAGE proteins in the inflamed pancreas.
Keywords: Receptor for advanced glycation endproducts (RAGE) isoforms, soluble RAGE, pancreatitis, hyperglycemia, inflammation, ERK1/ERK2 phosphorylation
Introduction
Acute as well as chronic pancreatitis often correlates with hyperglycemia in patients [1-4]. This correlation may be explained by two causal relationships. On the one hand it is well accepted that pancreatitis can cause the development of diabetes mellitus [2]. On the other hand several publications suggest that diabetes causes also the aggravation of pancreatitis [2]. For example, hyperglycemia may predispose patients with acute pancreatitis to systemic organ failure and patients with diabetes have a higher risk for pancreatitis [5-9]. Moreover, blood glucose level is an important criterion for assessing the prognosis of acute pancreatitis by the Ranson score and is also an accurate predictor of the outcome in gallstone pancreatitis [10,11]. In addition, experiments using an animal model for reversible edematous acute pancreatitis have demonstrated that hyperglycemia indeed aggravates pancreatitis by enhancing inflammation and inducing cell death, which results in ample atrophy of the pancreas [12].
A membrane bound receptor, which has been implicated in regulating inflammation, is the receptor for advanced glycation end products (RAGE) [13,14]. This receptor is activated by a diverse group of molecules such as S100 proteins, high mobility group box-1 (HMGB1) protein, lipopolysaccharide (LPS) or advanced glycation end products (AGEs) [15]. The association of these ligands with N-terminal domains of RAGE results in the induction of pro-inflammatory intracellular signaling cascades, such as the ERK1/ERK2 MAPK or the NF-κB signaling pathway [13]. Membrane bound RAGE has, therefore, a pro-inflammatory function during various pathologies such as rheumatoid arthritis, atherosclerosis, septic shock and endotoxemia [16-19]. Some truncated isoforms of RAGE, however, do not contain the membrane binding domain, but span the N-terminal extracellular ligand-binding domain. These isoforms are not membrane bound, but soluble, and have been proposed to have anti-inflammatory function by acting as a decoy for RAGE ligands [20]. Such soluble RAGE isoforms are produced by either proteolytic cleavage of the membrane bound RAGE or alternative splicing of the RAGE pre-mRNA [21-25]. Indeed, administration of soluble RAGE has been demonstrated to inhibit various diseases, such as atherosclerosis, ischemia/reperfusion injury and autoimmune diabetes [17,26-28]. Thus, different forms of RAGE have pro- and anti-inflammatory functions.
The aim of the present study was to assess i) if RAGE is expressed in the pancreas, ii) if the expression is altered during acute pancreatitis and iii) if the expression correlates with hyperglycemia induced aggravation of acute pancreatitis.
Materials and methods
Animals
8-12 weeks old C57BL/6J mice were grouped into 4 cohorts, which were either sham (Sham), cerulein (Cer), streptozotocin (STZ) or streptozotocin plus cerulein treated (STZ+Cer). Experiments were performed under analgesia as described previously [12]. In brief, diabetes was induced in two cohorts (STZ, STZ+Cer) by intraperitoneal (i.p.) injection of 50 mg/kg streptozotocin (Sigma-Aldrich, St Louis, MO, USA) on 5 consecutive days and diabetes was monitored with the blood glucose meter Contour (Bayer Vital, Leverkusen, Germany) for 3 weeks before pancreatitis was induced in two cohorts (Cer, STZ+Cer). Acute pancreatitis was induced either by administration of six i.p. injections of 50 μg/kg cerulein (Sigma-Aldrich) at a rate of one every hour (analysis: 5.5 hours after the first cerulein injection) or by administration of eight i.p. injections of 50 μg/kg cerulein at a rate of one every hour over 2 consecutive days (analysis: 33 hours after the first cerulein injection). All control mice were sham treated appropriately (0.9% wt/vol. saline solution instead of cerulein, 50 mmol/l sodium citrate pH 4.5 instead of STZ).
Analysis of plasma and tissue
Oedema formation was quantified as pancreas wet to dry weight ratio by dividing the weight of the pancreas after drying (for 48 h at 60°C) by the weight of the native pancreas. Blood samples were taken at the indicated time points after the first cerulein injection. The activity of lipase and amylase in plasma was analyzed using the Cobas c111 spectrophotometer (Roche Diagnostics, Mannheim, Germany). Pancreas and lung tissue for Western blots and immunohistochemistry was preserved at the indicated time points after the first cerulein injection and processed as described previously [12]. Western blots were performed by separating 10 mg pancreas lysate or 0.4 mg lung lysate on 12% (wt/vol.) SDS gels. After transferring the proteins to a polyvinyldifluoride membrane (Immobilon-P; Millipore) the membrane was blocked with 2.5% (wt/vol.) bovine serum albumin (BSA) and incubated overnight at 4°C with primary antibodies. As primary antibodies a goat anti-RAGE antibody raised against an epitope at the N-terminus of RAGE (Santa Cruz Biotechnology, Santa Cruz, USA; code sc8230, 1:1250), a goat anti-RAGE antibody raised against Gln24 to Ala342 of mouse RAGE (R&D Systems, Wiesbaden, Germany, code AF1179, 1:500), or a rabbit anti-phospho-ERK1/2(T202/Y204)/ERK2(T185/Y187) antibody (R&D Systems, code MAB1018, 1:1000) were used. After washing, the membrane was incubated for 2 hours at room temperature with a secondary peroxidase-linked anti-goat-antibody (Santa Cruz Biotechnology, code sc2020, 1:15000) or peroxidase-linked anti-rabbit-antibody (Cell Signaling, Boston, USA, code 7074, 1:5000). For analysis of β-tubulin or ERK1/ERK2 production, membranes were stripped, blocked by 2.5% (wt/vol.) BSA and incubated with a rabbit anti-β-tubulin antibody (Santa Cruz Biotechnology, code sc9104, 1:500) or a mouse anti-ERK1/ERK2 antibody (R&D Systems, code MAB15761, 1:500) followed by incubation of peroxidase conjugated anti-rabbit antibody (Cell Signaling, code 7074, 1:15000) or a peroxidase conjugated anti-mouse antibody (Sigma-Aldrich, code A9044, 1:20000). Proteins were detected by luminol-enhanced chemiluminescence and quantified by densitometry. The signal intensities of phospho-ERK1/ERK2 were corrected with the corresponding signal intensities of ERK1/ERK2. The signal intensities of all other proteins were corrected with the corresponding signal intensities of β-tubulin. Immunohistochemistry for RAGE was performed using a goat anti-RAGE antibody (Santa Cruz Biotechnology, code sc8230, 1:1000) and peroxidase conjugated donkey-anti-goat antibody (Santa Cruz Biotechnology, code sc2020, 1:100).
Statistics
Data are presented as box plots indicating the median, the interquartile range in form of a box, and the 10th and 90th percentiles as whiskers. Graphs were made by using SigmaPlot software version 12.0. The significance of data was assessed by SigmaStat software version 3.5 (SigmaStat, Jandel Corporation, San Rafael, CA, USA). Differences between the groups were calculated using Kruskal-Wallis One Way Analysis of Variance on Ranks with the pairwise multiple comparison procedure as suggested by the software and indicated in the figure legends. The criterion for significance was p<0.05.
Results
RAGE expression in the native pancreas
In order to compare RAGE expression in the pancreas to its well characterized expression in lung, the tissue lysates of both native organs were analyzed by Western blot using two distinct anti-RAGE antibodies (Figure 1A). In lung three RAGE proteins, the membrane bound X-RAGE, RAGE and a soluble sRAGE, were detected in agreement with previously published data [24,29]. In pancreas, however, six RAGE proteins were consistently detected by both antibodies (Figure 1A). Experiments leaving the pancreas up to 20 minutes at room temperature before lysing the tissue confirmed that the RAGE proteins with lower molecular weight were not degradation products of the RAGE proteins with higher molecular weight (data not shown). Immunohistochemistry revealed strong RAGE expression in acinar and interstitial cells as well as weak expression in the islets of Langerhans (Figure 1B-E).
Figure 1.
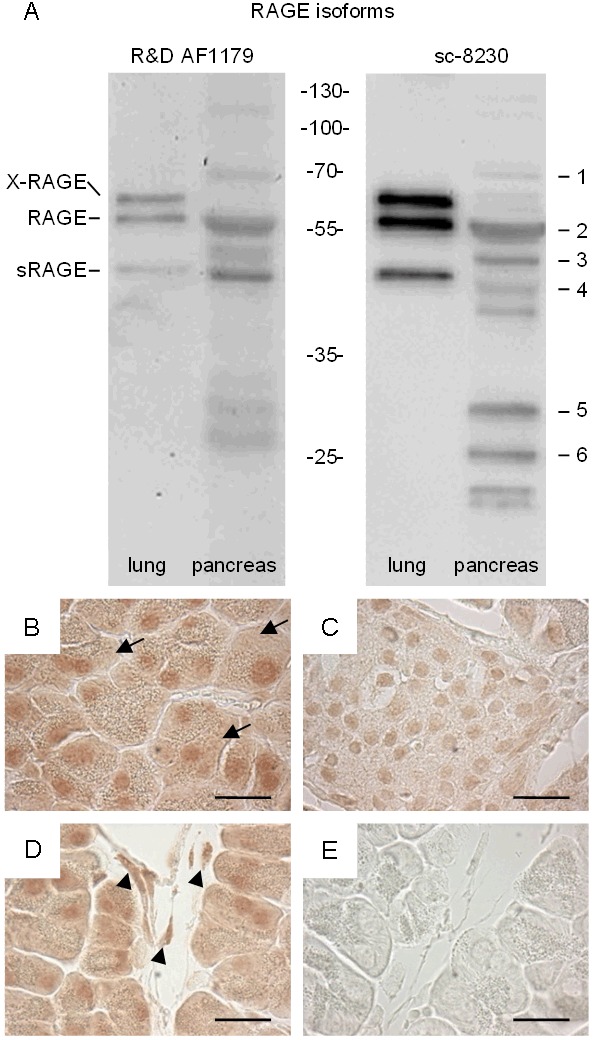
Detection of RAGE proteins in murine lung and pancreas. Western blots using two distinct anti-RAGE antibodies, R&D AF1179 and sc-8230, detected three and six RAGE proteins in murine lung and pancreas, respectively (A). Immunohistochemistry on pancreas tissue using the sc-8230 anti-RAGE antibody detected RAGE in acinar cells (B), in the islets of Langerhans (C), and in interstitial cells (D), while no staining was observed in the negative control when the primary antibody was omitted (E). Bar=20 micrometer.
Regulation of RAGE expression by hyperglycemia and pancreatitis
In order to assess if the expression of any of the six RAGE proteins (RAGE 1-6) is altered by hyperglycemia or acute pancreatitis, four distinct cohorts of mice were sham, cerulein, streptozotocin or streptozotocin plus cerulein treated. Repetitive cerulein injections induced acute pancreatitis 33 hours after the first cerulein administration, as characterized by increased lipase activity in the blood (Sham: 31/26-43, cerulein: 657/512-689, STZ: 27/25-31, STZ+cerulein: 1636/1076-1795, median/interquartile range in units/l). Consistent with previously published data, STZ+cerulein treatment caused higher lipase activity compared to cerulein-treated mice [12]. In mice treated with STZ three weeks before tissue asservation, the blood glucose concentration was strongly increased at the time point when pancreatitis was induced (Sham: 6.7/6.1-7.2, cerulein: 6.6/6.0-7.3, STZ: 31.5/28.2-33.3, STZ+cerulein: 29.0/19.2-32.6, median/interquartile range in mmol/l). The expression of RAGE 1 was modestly reduced by application of STZ, cerulein or the application of STZ+cerulein compared to sham-treated mice (Figure 2A-C). In contrast, the expression of RAGE 2-6 was reduced mainly by application of STZ+cerulein (Figure 2D-H). Especially RAGE 5 and 6 were reduced significantly by application of STZ+cerulein compared to cerulein-treated mice (Figure 2G and 2H). Evaluation of the pancreatic tissue by immunohistochemistry suggests a reduction of RAGE expression in acinar cells during inflammation (Figure 3A-D). However, at the same time point infiltrating inflammatory cells express RAGE strongly (Figure 3A-D). In summary, these data correlate the reduced expression of RAGE 5 and 6 with the previously published aggravation of acute pancreatitis caused by hyperglycemia [12].
Figure 2.
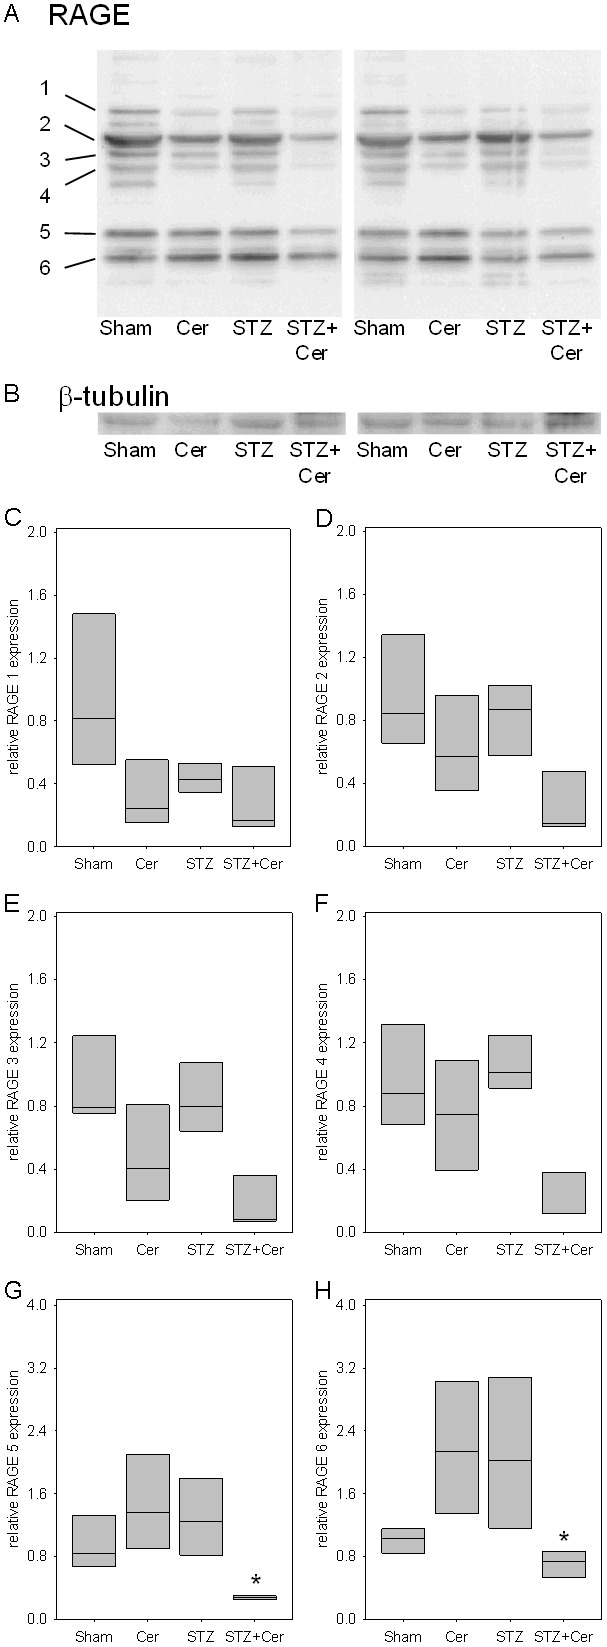
Influence of hyperglycemia and pancreatitis on RAGE proteins in the pancreas 33 hours after the first cerulein administration. Pancreas of control (sham), cerulein (Cer), streptozotocin (STZ) or streptozotocin plus cerulein (STZ+Cer) treated mice were analyzed by Western blots using the sc-8230 anti-RAGE antibody (A) and an anti-β-tubulin antibody as control (B). Densitometry of Western blots compared the expression of RAGE 1-6 (C-H) and revealed a significant reduction of RAGE 5 and 6 in STZ+cerulein treated mice (G and H). Values denote median and interquartile range. *p≤0.038 versus cerulein treated mice using Kruskal-Wallis One Way Analysis of Variance on Ranks followed by Tukey Test for all pairwise comparisons.
Figure 3.
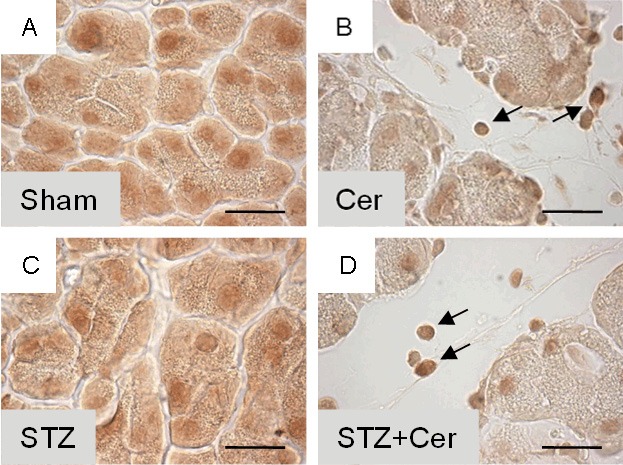
Influence of hyperglycemia and pancreatitis on RAGE in the pancreas 33 hours after the first cerulein administration. Pancreas of sham (A), cerulein (B), streptozotocin (C) or streptozotocin plus cerulein (D) treated mice were analyzed by immunohistochemistry using the sc-8230 anti-RAGE antibody. Infiltrating inflammatory cells produce RAGE indicated by arrows in B and D. Bar=20 μm.
Time course of ERK1/ERK2 activation and RAGE expression
In order to evaluate at which time point a classical RAGE induced signal transduction pathway, the ERK1/ERK2 MAPK pathway, is activated during acute pancreatitis, we evaluated the phosphorylation of ERK1/ERK2 on various time points during the first and second day of repetitive cerulein administration. Cerulein induces the phosphorylation of ERK1/ERK2 within 1.5 hours after the first cerulein injection and the phosphorylation reaches its maximum at 5.5 hours after the first cerulein administration (Figure 4A-C). At 5.5 as well as 10 hours after the first cerulein injection the amount of RAGE protein 5 and 6 was moderately increased (Figure 4D and 4E). These data suggest that phosphorylation of ERK1/ERK2 might be studied best 5.5 hours after the first cerulein injection.
Figure 4.
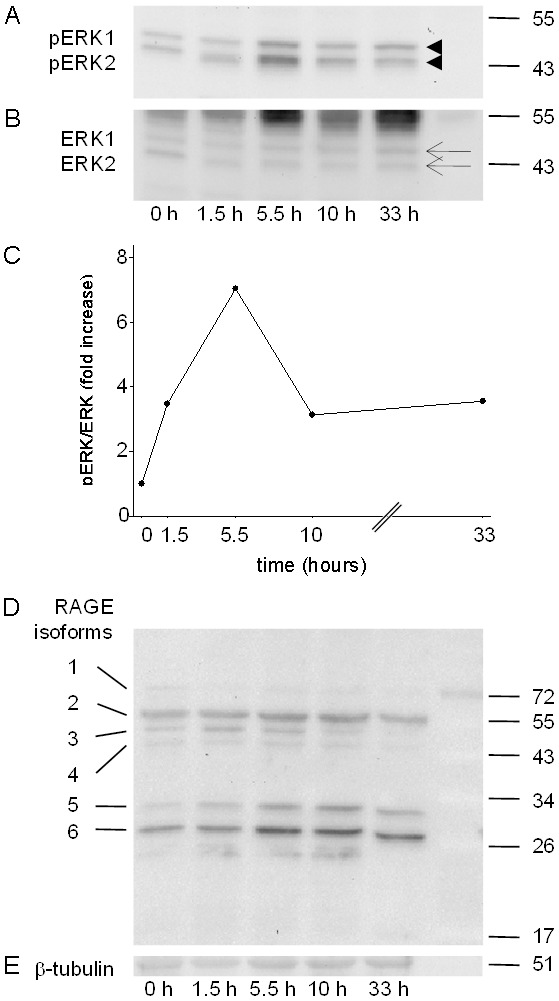
Time course of ERK1/ERK2 activation and RAGE expression during repetitive cerulein administration. The phosphorylation of ERK1/ERK2 was analyzed by Western blots (arrowheads, A) and compared to ERK1/ERK2 expression (arrows, B) at the indicated time points after the first cerulein administration. The phosphorylation intensity of ERK1/ERK2 reveals a maximum of phosphorylation at 5.5 hours after the first cerulein administration (C). No obvious effect on the expression level of any of the six RAGE proteins was observed 5.5 hours after the first cerulein administration (D) compared to β-tubulin expression (E).
ERK1/ERK2 activation and RAGE expression during the early phase of acute pancreatitis
In order to assess, if the ERK1/ERK2 MAPK signal transduction pathway is altered by hyperglycemia or pancreatitis 5.5 hours after the first cerulein injection, the phosphorylation of ERK1/ERK2 was assessed in sham, cerulein, STZ and STZ+cerulein-treated animals 5.5 hours after the first cerulein administration. Both cerulein as well as STZ+cerulein treatment caused strong phosphorylation of ERK1/ERK2 (Figure 5A and 5B). However, STZ+cerulein administration did not lead to a significantly altered phosphorylation of ERK1/ERK2 compared to cerulein-treated mice (Figure 5C). The expression of RAGE 5 and 6 was also almost unchanged when comparing the STZ+cerulein with cerulein-treated mice (RAGE 5: cerulein 1.4/0.9-2.1, STZ+cerulein 1.3/0.9-1.3, RAGE 6: cerulein 1.4/1.2-1.7, STZ+cerulein 1.3/1.1-1.7, median/interquartile range in relative expression intensity). At this early time point cerulein as well as STZ+cerulein application caused increased wet to dry weight ratio of the pancreas (Figure 5D). Furthermore lipase as well as amylase activity were increased in the blood plasma compared to sham-treated mice (Figure 5E and 5F). However, STZ+cerulein administration, compared to cerulein-treated mice, did neither lead to a significantly altered wet to dry weight ratio of the pancreas nor to significantly altered lipase or amylase activities at this early time point (Figure 5D-F). Hyperglycemia, therefore, has no obvious effect on the early phase of acute pancreatitis in contrast to strong aggravation of pancreatitis at a later time point [12].
Figure 5.
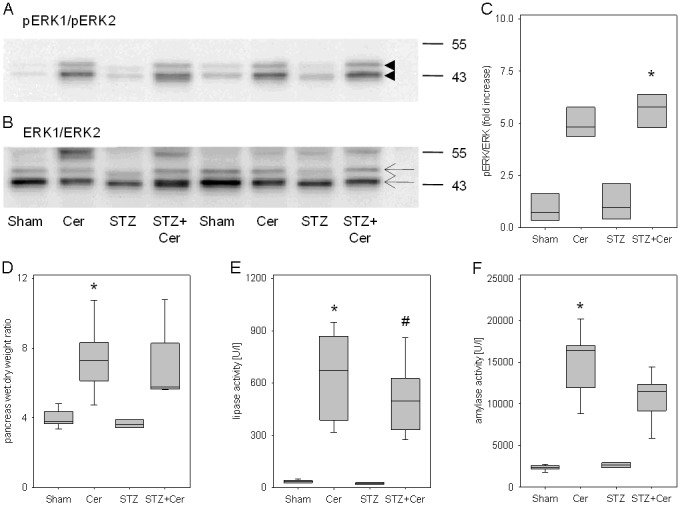
Influence of hyperglycemia and cerulein administration on RAGE proteins and on parameters of pancreatitis 5.5 hours after the first cerulein administration. Pancreas and blood plasma of control (sham), cerulein (Cer), streptozotocin (STZ) or streptozotocin plus cerulein (STZ+Cer) treated mice were analyzed. The phosphorylation of ERK1/ERK2 (arrowheads, A) was compared to ERK1/ERK2 expression (arrows, B) by Western blots. The quantification by densitometry reveals increased phosphorylation of ERK1/ERK2 after cerulein as well as STZ+cerulein treatment (C). Pancreatitis was quantified by pancreas wet to dry weight ratio (D) and lipase (E) and amylase (F) activity in blood plasma. Box plots indicate the median, the interquartile range in the form of a box and the 10th and 90th percentiles as whiskers. *p≤0.01 versus sham treated mice and #p≤0.003 versus STZ treated mice using Kruskal-Wallis One Way Analysis of Variance on Ranks followed by Tukey Test (C) or Dunn’s Method (D-F) for all pairwise comparisons.
Discussion
The evaluation of RAGE expression in the pancreas demonstrates that i) six RAGE proteins with distinct apparent molecular weight can be detected in the pancreas (Figures 1A and 2A), ii) the expression of two RAGE proteins is significantly reduced in hyperglycemic mice during the late phase of acute pancreatitis (Figure 2A) and iii) that this reduction correlates with an aggravation of acute pancreatitis [12].
For the detection of the six RAGE proteins in pancreas, two different RAGE antibodies were used to control for possible unspecific binding of an antibody to other proteins. These two anti-RAGE antibodies were either raised against a peptide mapping directly at the N-terminus of RAGE [29] or were raised against Gln24 to Ala342 of RAGE. Since the N-terminal Ig domain, called V domain (amino acid 34-110 of mouse RAGE), is the primary binding site for most ligands, we reason that all six detected RAGE proteins in the pancreas may bind RAGE ligands [30]. RAGE 2 has a similar molecular weight as the membrane bound RAGE isoform in the lung and might therefore be a membrane bound full length RAGE protein [24,29]. RAGE proteins with lower molecular weight, such as RAGE 4, 5 and 6, contain the N-terminus of RAGE, but probably not the entire C-terminal domain. Since the membrane binding domain of RAGE is encoded by amino acids 341-361 close to the C-terminus [30], such proteins would not be membrane bound, but soluble. Such proteins have been described previously in the literature and are generated by a sheddase which proteolytically processes full length RAGE or by alternative splicing of the pre-mRNA of RAGE [20-25]. Soluble RAGE (sRAGE) has been demonstrated to inhibit inflammation in several pathological processes such as atherosclerosis, ischemia/reperfusion injury and autoimmune diabetes by serving as decoy receptor for RAGE ligands [17,26-28]. In pancreas we do observe a RAGE protein with very similar molecular weight to sRAGE (RAGE 4). Its expression is reduced after STZ+cerulein application compared to cerulein treatment (Figure 2F). Due to the anti-proliferative function of sRAGE in other distinct diseases, the reduced expression of RAGE 4 in hyperglycemic mice could be partially responsible for the observed aggravation of acute pancreatitis by hyperglycemia [12]. Interestingly, we also observe two additional RAGE proteins with approximate molecular weight of 32 (RAGE 5) and 27 kDa (RAGE 6). The expression of these small RAGE proteins, is significantly reduced after STZ+cerulein application compared to cerulein treatment (Figure 2G and 2H). In analogy to sRAGE, the reduced expression of RAGE 5 and RAGE 6 in hyperglycemic mice could be partially responsible for the observed aggravation of acute pancreatitis by hyperglycemia [12]. RAGE 5 and RAGE 6 might act as decoy receptor for HMGB1, LPS or S100 proteins which stimulate inflammation by binding to receptors such as TLR4 or membrane bound RAGE [13,31]. Since RAGE has been described to be alternatively spliced, proteolytically processed and N-glycosylated, any of these processes or even a combination of them might result in the six RAGE proteins in the pancreas [20,21,23-25,29,32]. It has been reported that PNGaseF treated lung extract resulted in deglycosylated RAGE proteins with an apparent molecular weight well above 40 kDa [29]. Interestingly, RAGE 5 and 6 have an apparent molecular weight well below 35 kDa. Thus it is unlikely that a lack of N-glycosylation alone can explain the low molecular weights of RAGE 5 and RAGE 6. It is more likely that these short proteins are generated by alternative splicing or proteolytic processing of RAGE.
The aggravation of acute pancreatitis by hyperglycemia was observed at late time points such as 33 hours after the first cerulein administration and during the regeneration phase of the pancreas [12], but was not observed during the early phase of pancreatitis, 5.5 hours after the first cerulein injection (Figure 5D-F). This suggests, that hyperglycemia does not influence early events during pancreatitis, but might have a major influence on the perpetuation of inflammation. Since RAGE has also been suggested to regulate the perpetuation of inflammation in other context [33], it is likely that it has a similar function during pancreatitis. Hyperglycemia might therefore aggravate pancreatitis by increasing the concentration of AGEs or other RAGE ligands and by reducing the expression of soluble RAGE proteins with anti-inflammatory functions.
Based on the correlation of RAGE 5 and RAGE 6 production in the pancreas and the progression of pancreatitis, additional research could focus on the following questions: i) Can the RAGE 5 and RAGE 6 proteins be isolated and the amino acid sequences be defined? ii) Do these two RAGE proteins inhibit inflammation? iii) Are these RAGE proteins more or less potent than sRAGE in inhibiting inflammation? And iv) does RAGE influence pancreatitis?
Acknowledgements
We thank Berit Blendow, Dorothea Frenz, Eva Lorbeer-Rehfeldt and Maren Nerowski (Institute for Experimental Surgery, University of Rostock) for excellent technical assistance. The study was supported by a grant from the FORUN program of the University of Rostock (project 889017).
Disclosure of conflict of interest
None of the authors have any conflicts of interest.
References
- 1.Angelopoulos N, Dervenis C, Goula A, Rombopoulos G, Livadas S, Kaltsas D, Kaltzidou V, Tolis G. Endocrine pancreatic insufficiency in chronic pancreatitis. Pancreatology. 2005;5:122–131. doi: 10.1159/000085264. [DOI] [PubMed] [Google Scholar]
- 2.Czako L, Hegyi P, Rakonczay Z, Wittmann T, Otsuki M. Interactions between the endocrine and exocrine pancreas and their clinical relevance. Pancreatology. 2009;9:351–359. doi: 10.1159/000181169. [DOI] [PubMed] [Google Scholar]
- 3.Raman VS, Loar RW, Renukuntla VS, Hassan KV, Fishman DS, Gilger MA, Heptulla RA. Hyperglycemia and diabetes mellitus in children with pancreatitis. J Pediatr. 2011;158:612–616. doi: 10.1016/j.jpeds.2010.09.066. [DOI] [PubMed] [Google Scholar]
- 4.Shenoy SD, Cody D, Rickett AB, Swift PG. Acute pancreatitis and its association with diabetes mellitus in children. J Pediatr Endocrinol Metab. 2004;17:1667–1670. doi: 10.1515/jpem.2004.17.12.1667. [DOI] [PubMed] [Google Scholar]
- 5.Girman CJ, Kou TD, Cai B, Alexander CM, O’Neill EA, Williams-Herman DE, Katz L. Patients with type 2 diabetes mellitus have higher risk for acute pancreatitis compared with those without diabetes. Diabetes Obes Metab. 2010;12:766–771. doi: 10.1111/j.1463-1326.2010.01231.x. [DOI] [PubMed] [Google Scholar]
- 6.Mentula P, Kylanpaa ML, Kemppainen E, Puolakkainen P. Obesity correlates with early hyperglycemia in patients with acute pancreatitis who developed organ failure. Pancreas. 2008;36:e21–25. doi: 10.1097/mpa.0b013e31814b22b5. [DOI] [PubMed] [Google Scholar]
- 7.Noel RA, Braun DK, Patterson RE, Bloomgren GL. Increased risk of acute pancreatitis and biliary disease observed in patients with type 2 diabetes: a retrospective cohort study. Diabetes Care. 2009;32:834–838. doi: 10.2337/dc08-1755. [DOI] [PMC free article] [PubMed] [Google Scholar]
- 8.Renner IG, Savage Wr, Pantoja JL, Renner VJ. Death due to acute pancreatitis. A retrospective analysis of 405 autopsy cases. Digest Dis Sci. 1985;30:1005–1018. doi: 10.1007/BF01308298. [DOI] [PubMed] [Google Scholar]
- 9.Seicean A, Tantau M, Grigorescu M, Mocan T, Seicean R, Pop T. Mortality risk factors in chronic pancreatitis. J Gastrointestin Liver Dis. 2006;15:21–26. [PubMed] [Google Scholar]
- 10.Rajaratnam SG, Martin IG. Admission serum glucose level: an accurate predictor of outcome in gallstone pancreatitis. Pancreas. 2006;33:27–30. doi: 10.1097/01.mpa.0000222315.36490.9b. [DOI] [PubMed] [Google Scholar]
- 11.Ranson JH, Rifkind KM, Roses DF, Fink SD, Eng K, Spencer FC. Prognostic signs and the role of operative management in acute pancreatitis. Surg Gynecol Obstet. 1974;139:69–81. [PubMed] [Google Scholar]
- 12.Zechner D, Spitzner M, Bobrowski A, Knapp N, Kuhla A, Vollmar B. Diabetes aggravates acute pancreatitis and inhibits pancreas regeneration in mice. Diabetologia. 2012;55:1526–1534. doi: 10.1007/s00125-012-2479-3. [DOI] [PubMed] [Google Scholar]
- 13.Christaki E, Lazaridis N, Opal SM. Receptor for advanced glycation end products in bacterial infection: is there a role for immune modulation of receptor for advanced glycation end products in the treatment of sepsis? Curr Opin Infect Dis. 2012;25:304–311. doi: 10.1097/QCO.0b013e3283519b82. [DOI] [PubMed] [Google Scholar]
- 14.Ramasamy R, Yan SF, Am S. RAGE: therapeutic target and biomarker of the inflammatory response--the evidence mounts. J Leukocyte Biol. 2009;86:505–512. doi: 10.1189/jlb.0409230. [DOI] [PubMed] [Google Scholar]
- 15.Fritz G. RAGE: a single receptor fits multiple ligands. Trends Biochem Sci. 2011;36:625–632. doi: 10.1016/j.tibs.2011.08.008. [DOI] [PubMed] [Google Scholar]
- 16.Basta G, Lazzerini G, Massaro M, Simoncini T, Tanganelli P, Fu C, Kislinger T, Stern DM, Schmidt AM, Caterina Rd. Advanced glycation end products activate endothelium through signal-transduction receptor RAGE: a mechanism for amplification of inflammatory responses. Circulation. 2002;105:816–822. doi: 10.1161/hc0702.104183. [DOI] [PubMed] [Google Scholar]
- 17.Bucciarelli LG, Wendt T, Qu W, Lu Y, Lalla E, Rong LL, Goova MT, Moser B, Kislinger T, Lee DC, Kashyap Y, Stern DM, Am S. RAGE blockade stabilizes established atherosclerosis in diabetic apolipoprotein E-null mice. Circulation. 2002;106:2827–2835. doi: 10.1161/01.cir.0000039325.03698.36. [DOI] [PubMed] [Google Scholar]
- 18.Kuhla A, Hauke M, Sempert K, Vollmar B, Zechner D. Senescence-dependent impact of anti-RAGE antibody on endotoxemic liver failure. Age (Dordr) 2013 doi: 10.1007/s11357-012-9506-7. [Epub ahead of print] [DOI] [PMC free article] [PubMed] [Google Scholar]
- 19.Liliensiek B, Weigand MA, Bierhaus A, Nicklas W, Kasper M, Hofer S, Plachky J, Gröne HJ, Kurschus FC, Schmidt AM, Yan SD, Martin E, Schleicher E, Stern DM, Hämmerling G Gü, Nawroth PP, Arnold B. Receptor for advanced glycation end products (RAGE) regulates sepsis but not the adaptive immune response. J Clin Invest. 2004;113:1641–1650. doi: 10.1172/JCI18704. [DOI] [PMC free article] [PubMed] [Google Scholar]
- 20.Yonekura H, Yamamoto Y, Sakurai S, Petrova RG, Abedin MJ, Li H, Yasui K, Takeuchi M, Makita Z, Takasawa S, Okamoto H, Watanabe T, Yamamoto H. Novel splice variants of the receptor for advanced glycation end-products expressed in human vascular endothelial cells and pericytes, and their putative roles in diabetes-induced vascular injury. Biochem J. 2003;370:1097–1109. doi: 10.1042/BJ20021371. [DOI] [PMC free article] [PubMed] [Google Scholar]
- 21.Hanford L, Enghild JJ, Valnickova Z, Petersen SV, Schaefer LM, Schaefer TM, Reinhart TA, Oury TD. Purification and characterization of mouse soluble receptor for advanced glycation end products (sRAGE) J Biol Chem. 2004;279:50019–50024. doi: 10.1074/jbc.M409782200. [DOI] [PMC free article] [PubMed] [Google Scholar]
- 22.Hudson BI, Am C, Harja E, Kalea AZ, Arriero M, Yang H, Grant PJ, Am S. Identification, classification, and expression of RAGE gene splice variants. FASEB J. 2008;22:1572–1580. doi: 10.1096/fj.07-9909com. [DOI] [PubMed] [Google Scholar]
- 23.Kalea AZ, Reiniger N, Yang H, Arriero M, Am S, Hudson BI. Alternative splicing of the murine receptor for advanced glycation end-products (RAGE) gene. FASEB J. 2009;23:1766–1774. doi: 10.1096/fj.08-117739. [DOI] [PMC free article] [PubMed] [Google Scholar]
- 24.Raucci A, Cugusi S, Antonelli A, Barabino SM, Monti L, Bierhaus A, Reiss K, Saftig P, Bianchi ME. A soluble form of the receptor for advanced glycation endproducts (RAGE) is produced by proteolytic cleavage of the mem- brane-bound form by the sheddase a disintegrin and metalloprotease 10 (ADAM10) FASEB J. 2008;22:3716–3727. doi: 10.1096/fj.08-109033. [DOI] [PubMed] [Google Scholar]
- 25.Zhang L, Bukulin M, Kojro E, Roth A, Metz VV, Fahrenholz F, Nawroth PP, Bierhaus A, Postina R. Receptor for advanced glycation end products is subjected to protein ectodomain shedding by metalloproteinases. J Biol Chem. 2008;283:35507–35516. doi: 10.1074/jbc.M806948200. [DOI] [PubMed] [Google Scholar]
- 26.Bucciarelli LG, Kaneko M, Ananthakrishnan R, Harja E, Lee LK, Hwang YC, Lerner S, Bakr S, Li Q, Lu Y, Song F, Qu W, Gomez T, Zou YS, Yan SF, Am S, Ramasamy R. Receptor for advanced-glycation end products: key modulator of myocardial ischemic injury. Circulation. 2006;113:1226–1234. doi: 10.1161/CIRCULATIONAHA.105.575993. [DOI] [PubMed] [Google Scholar]
- 27.Chen Y, Yan SS, Colgan J, Zhang HP, Luban J, Schmidt AM, Stern D, Herold KC. Blockade of late stages of autoimmune diabetes by inhibition of the receptor for advanced glycation end products. J Immunol. 2004;173:1399–1405. doi: 10.4049/jimmunol.173.2.1399. [DOI] [PubMed] [Google Scholar]
- 28.Park L, Raman KG, Lee KJ, Lu Y, Ferran LJ, Chow WS, Stern D, Am S. Suppression of accelerated diabetic atherosclerosis by the soluble receptor for advanced glycation endproducts. Nat Med. 1998;4:1025–1031. doi: 10.1038/2012. [DOI] [PubMed] [Google Scholar]
- 29.Gefter JV, Shaufl AL, Fink MP, Delude RL. Comparison of distinct protein isoforms of the receptor for advanced glycation end-products expressed in murine tissues and cell lines. Cell Tissue Res. 2009;337:79–89. doi: 10.1007/s00441-009-0791-0. [DOI] [PubMed] [Google Scholar]
- 30.National Center for Biotechnology Information 2013 - proteins database. Bethesda, M.: National Center for Biotechnology Information; [Google Scholar]
- 31.Yu L, Wang L, Chen S. Endogenous toll-like receptor ligands and their biological significance. J Cell Mol Med. 2010;14:2592–2603. doi: 10.1111/j.1582-4934.2010.01127.x. [DOI] [PMC free article] [PubMed] [Google Scholar]
- 32.Srikrishna G, Huttunen HJ, Johansson L, Weigle B, Yamaguchi Y, Rauvala H, Freeze HH. N -Glycans on the receptor for advanced glycation end products influence amphoterin binding and neurite outgrowth. J Neurochem. 2002;80:998–1008. doi: 10.1046/j.0022-3042.2002.00796.x. [DOI] [PubMed] [Google Scholar]
- 33.Bopp C, Bierhaus A, Hofer S, Bouchon A, Nawroth PP, Martin E, Weigand MA. Bench-to-bedside review: The inflammation-perpetuating pattern-recognition receptor RAGE as a therapeutic target in sepsis. Crit Care. 2008;12:201. doi: 10.1186/cc6164. [DOI] [PMC free article] [PubMed] [Google Scholar]


