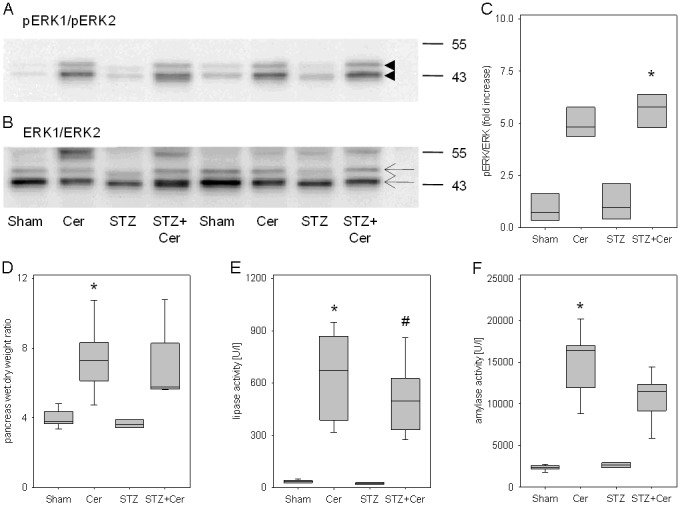
Figure 5.

Influence of hyperglycemia and cerulein administration on RAGE proteins and on parameters of pancreatitis 5.5 hours after the first cerulein administration. Pancreas and blood plasma of control (sham), cerulein (Cer), streptozotocin (STZ) or streptozotocin plus cerulein (STZ+Cer) treated mice were analyzed. The phosphorylation of ERK1/ERK2 (arrowheads, A) was compared to ERK1/ERK2 expression (arrows, B) by Western blots. The quantification by densitometry reveals increased phosphorylation of ERK1/ERK2 after cerulein as well as STZ+cerulein treatment (C). Pancreatitis was quantified by pancreas wet to dry weight ratio (D) and lipase (E) and amylase (F) activity in blood plasma. Box plots indicate the median, the interquartile range in the form of a box and the 10th and 90th percentiles as whiskers. *p≤0.01 versus sham treated mice and #p≤0.003 versus STZ treated mice using Kruskal-Wallis One Way Analysis of Variance on Ranks followed by Tukey Test (C) or Dunn’s Method (D-F) for all pairwise comparisons.
