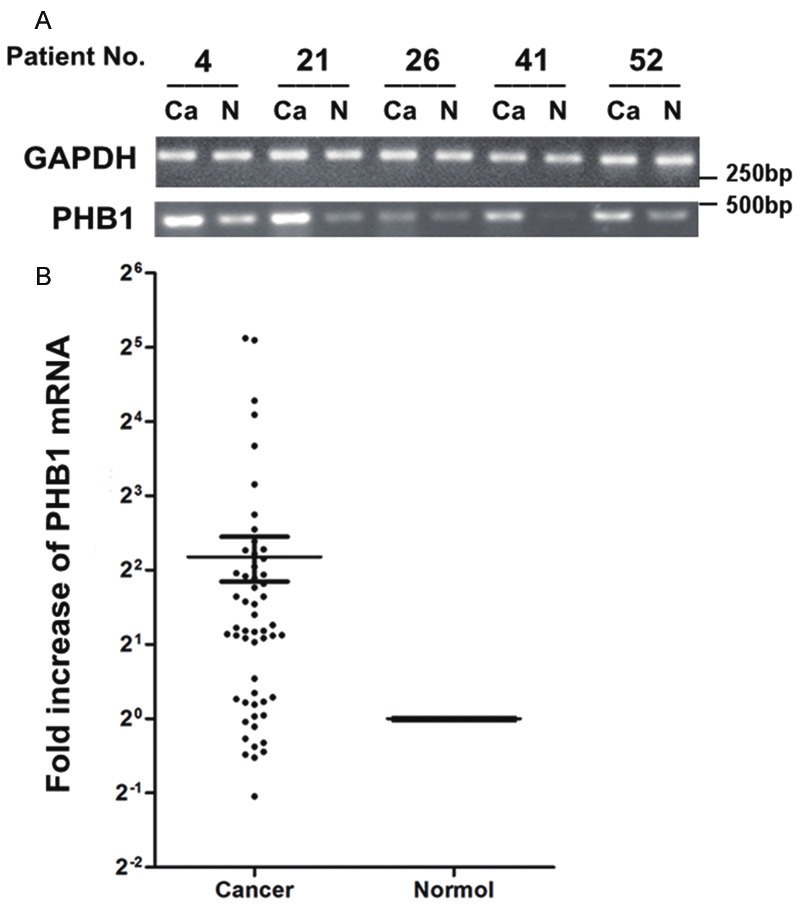
Figure 1.

Expression of PHB1 in lung cancer tissues measured by RT-PCR and RT-qPCR. A. The matched cancerous (Ca) and relevant normal (N) tissues from each patient were analyzed by RT-PCR using GAPDH- and PHB1-specific primers (n = 5). After normalized to GAPDH levels, the results of RT-PCR showed significantly increased mRNA levels of PHB1 in cancer compared to normal. B. PHB1 expression in 55 NSCLC samples was measured by RT-qPCR. PHB1 mRNA was increased in 67.3% (37 of 55) tumors. Mean fold increase in the tumor tissue relative to non-neoplastic lung tissue was shown. Bars, SEM. The increased folds of “> 2” were defined as “increased”, whereas increased folds of “≤ 2” were defined as “not increased”.
