
Figure 4.
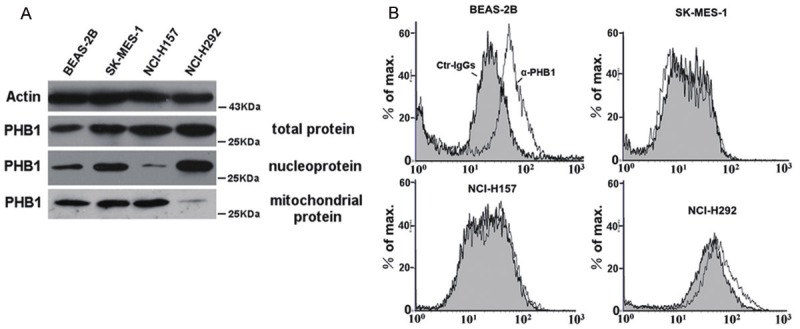
Western blotting and flow cytometric analysis for the subcellular localization of PHB1 in lung cell lines. A. Western blotting of cell lysates from four cell lines. Expression of actin was served as a control. The expression of PHB1 in total protein of all cancer cell lines were obviously increased when compared with BEAS-2B. PHB1 in nucleoprotein and mitochondrial fractions of SK-MES-1 were all increased; Mitochondrial PHB1 of NCI-H157 was increased but significantly decreased in nucleoprotein; PHB1 in nucleoprotein of NCI-H292 increased obviously but decreased in mitochondrial fractions. B. Flow cytometric analysis for surface expression of PHB1 in four lung cell lines. BEAS-2B cells express relatively high levels of PHB1. The NCI-H292 cells expresses low levels of PHB1 and little or no PHB1 was present in the SK-MES-1 and NCI-H157 cells.