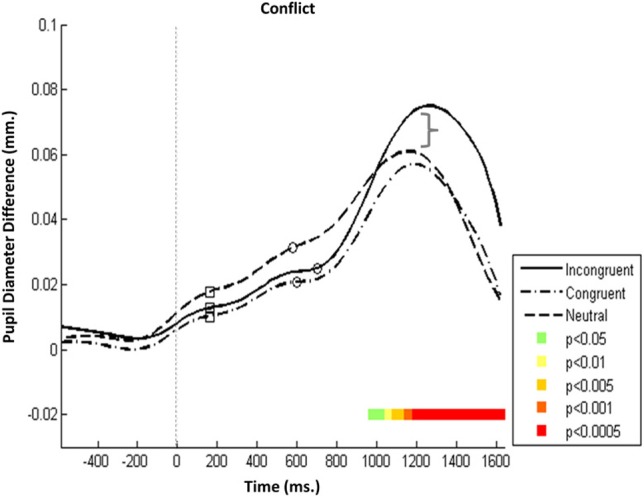
Figure 4.

Executive attention network—Mean PD dilation. Blue line, incongruent flankers trials; black line, congruent flankers trials; cyan line, neutral flankers trials; white squares, mean entrance to target AOI; white circles, mean response time. Time zero represents target onset (dashed gray line) and −500 ms cue onset (dotted gray line).
