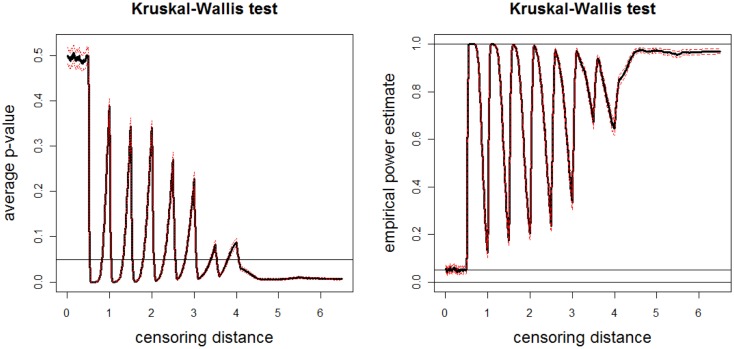
Figure 10.
Plotted in the left is the average p-values (solid line) and in the right is the empirical power estimates (solid line) versus censoring distance values for multi-group K–W test together with the 95% confidence bands (dashed lines) based on 10000 Monte Carlo replications of censored , , and sets that are generated under the alternative hypothesis Eq 13. Horizontal lines are at 0.05 and 0.95.

