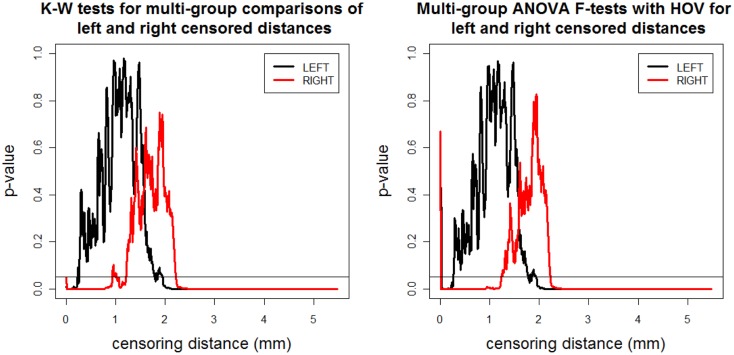
Figure 3.
The p-values versus censoring distance values (millimeter) for multi-group K–W test (left) and ANOVA F-test with HOV (right) for LCDM distances for left (thick black solid line) and right (thin red solid line) VMPFCs. Horizontal lines are located at 0.05 to indicate the threshold values for significance.

