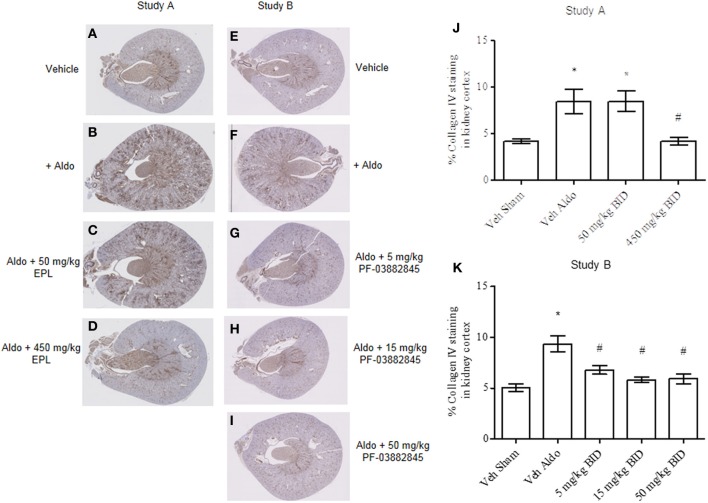
Figure 6.
Representative images of collagen IV immunohistochemical localization in kidney cortex. Study A, vehicle sham (A), vehicle + aldosterone (B), 50 mg/kg BID eplerenone (C), and 450 mg/kg BID eplerenone (D), groups following 27 days of treatment; and Study B, kidney cortex from sham vehicle (E), vehicle + aldosterone (F), 5 mg/kg BID PF-03882845 (G), 15 mg/kg BID PF-03882845 (H), and 50 mg/kg BID PF-03882845 (I) following 27 days of treatment. Data expressed as % collagen IV staining in kidney cortex and represented as mean ± standard error of the mean: Study A (J) and Study B (K). See Materials and Methods for statistical analysis. *Indicates a significant difference from the vehicle sham (Veh Sham) group; #Indicates a significant difference from the vehicle + aldosterone (Veh Aldo) group.

