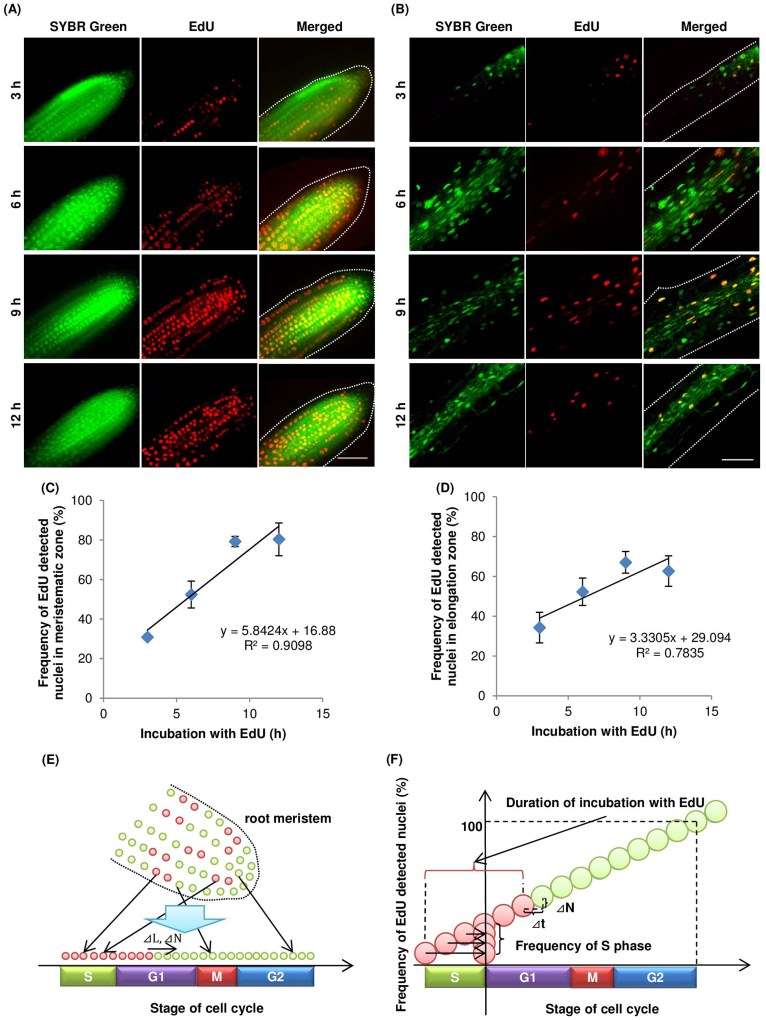
Figure 1. Visualization and frequency of nuclei undergoing DNA replication in A. thaliana roots.
A. thaliana seedlings were incubated in MS medium containing 10 μM EdU for indicated periods, fixed, and processed to detect EdU (red) and DNA staining with SYBR Green (green), as described in the Methods. Meristematic (A and C) and elongation (B and D) zones were analysed by confocal microscopy. (A and B) Representative images for each incubation time point. Scale bar = 50 μm. (C and D) Lines were drawn by least squares (n = 4). (E) Schematic figure of root meristem after EdU incorporation. Green and red circles indicate EdU-negative and positive nuclei, respectively. Cell-cycle stages of nuclei in the meristematic zone are random but can be placed in sequence if nuclei are abundant. L, stage of cell cycle; N, number of the EdU-positive nuclei. (F) Idealized graph of relationship between EdU incubation time and frequency of EdU-positive nuclei. Speed of cell cycle progression is related to increased frequency of EdU-positive nuclei (see equation 3 in Methods). The increase in the frequency of EdU-positive nuclei was calculated from the linear approximation obtained by plotting EdU incubation time (t) against frequency of EdU-positive nuclei (N).

