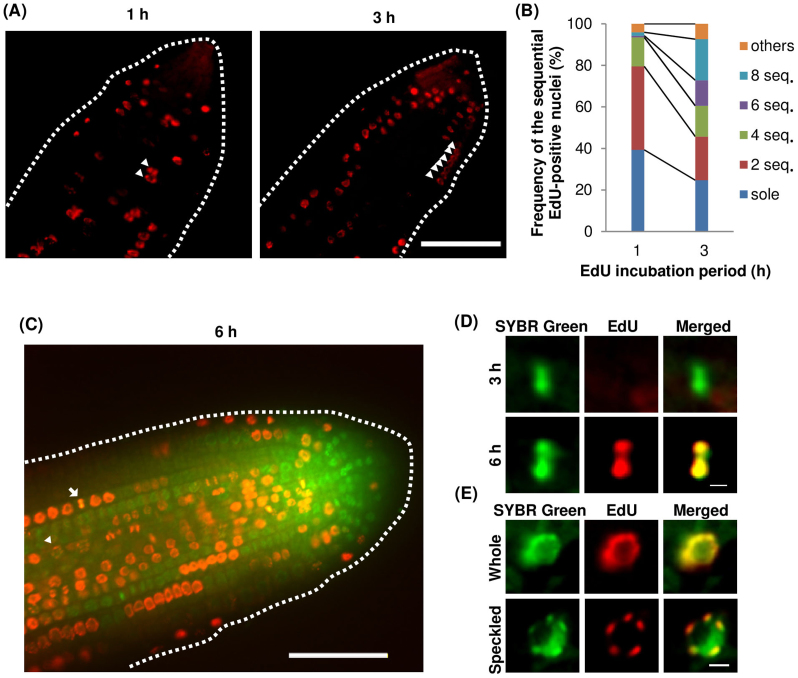
Figure 2. Cell division patterns in the meristematic zone of A. thaliana roots.
(A) EdU-positive cells in the meristematic zone after 1 h and 3 h of EdU incorporation (performed as described in Figure 1). Arrowheads indicate EdU-incorporated nuclei in adjacent cells. Bar = 50 μm. (B) Frequency of 1, 2, 4, 6, and 8 EdU-positive adjacent nuclei. (C) EdU-incorporated nuclei in the meristematic region after 6 h EdU incorporation. An arrowhead and an arrow indicate a speckled patterned nuclear and metaphase chromosomes, respectively. Scale bar = 50 μm. (D) Magnification of a metaphase cell after 3 h EdU incorporation (top) and 6 h EdU incorporation (bottom). (E) Magnifications of whole and speckled patterns of EdU signals. Bar = 3 μm.

