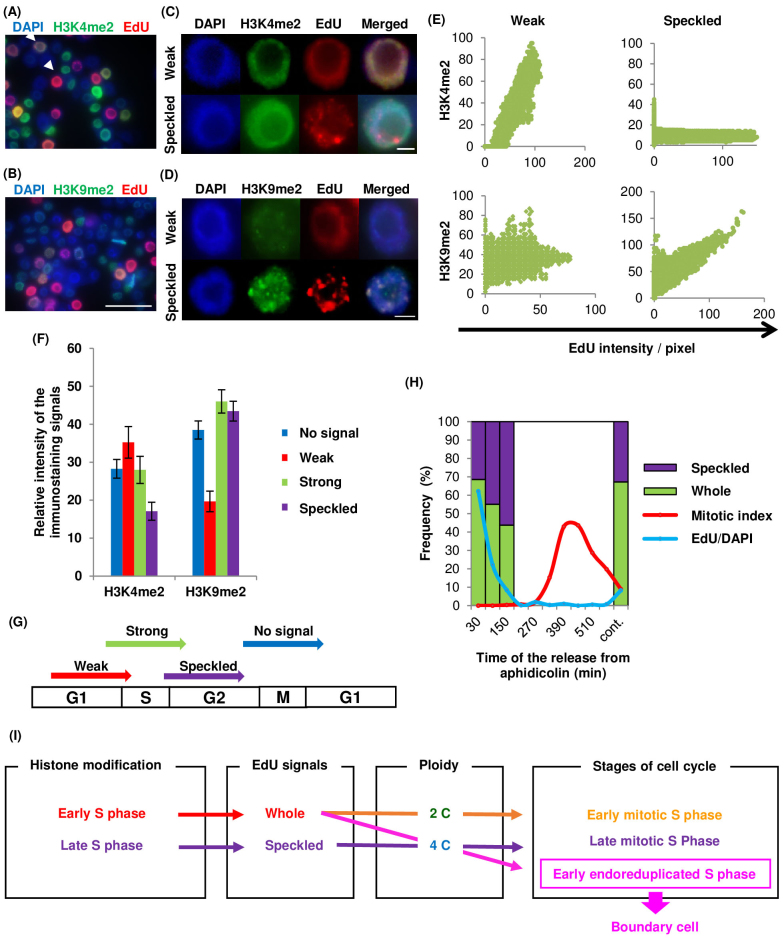
Figure 3. Immunostaining of Nicotiana tabacum BY-2 cultured cells and cell-cycle synchronization.
Immunostaining to detect histone modifications in nuclei of Nicotiana tabacum BY-2 cultured cells; (A) H3K4me2, (B) H3K9me2. Arrowheads in (A) indicate weak whole (left top) and strong whole (right bottom) patterned cells. Scale bars = 50 μm. Magnification of weak whole and speckled patterns with (C) H3K4me2 and (D) H3K9me2 staining. Scale bars = 5 μm. (E) Graphs showing relationship between EdU signal intensity and histone modification staining. Vertical and horizontal axes represent intensity of histone modification staining and EdU signals, respectively. (F) Graph of relative H3K4me2 and H3K9me2 staining intensities among the patterns classified as no signal, weak whole, and strong whole EdU signals (n > 50). (G) Model of the EdU signal patterns and timing of EdU incorporation. (H) Synchronization of cell-cycle in BY-2 cultured cells using aphidicolin. Frequency of speckled and whole patterns of EdU signals (purple and green), frequency of EdU-incorporated cells (blue line), and mitotic index (red line). (I) Flow chart of relationships among histone modification, EdU signals, ploidy, and cell cycle stages. Whole and speckled EdU signal patterns indicate early and late S phase, respectively; 4C nuclei with the whole pattern of EdU signals are in the early S phase, and indicate the boundary cells that are located at the starting point of endoreduplication.

