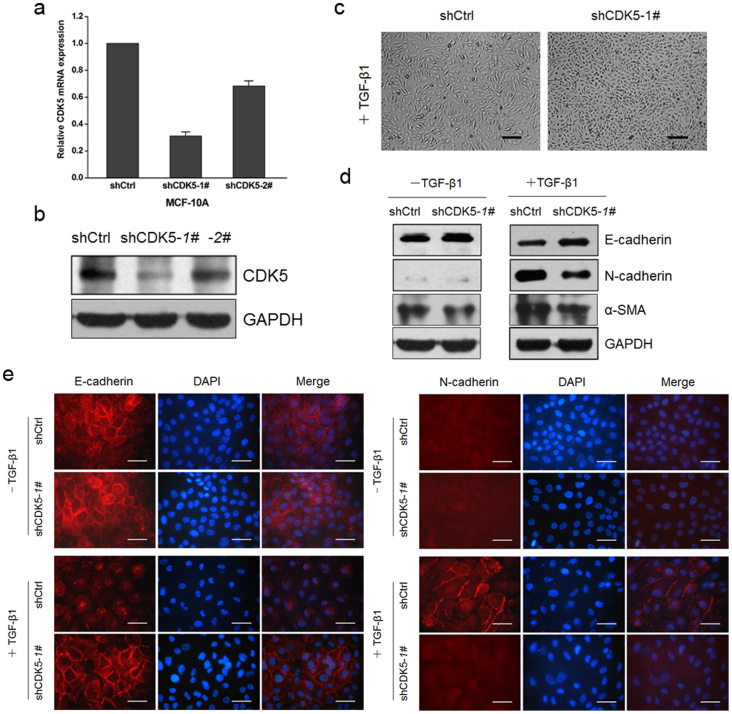
Figure 3. Knockdown of CDK5 inhibited TGF-β1-induced EMT.
(a) and (b) assessment of the repression efficiency of CDK5 mRNA (a) and protein (b) expression after retroviral infection in MCF10A cells. Error bars represent the mean ± SD of triplicate experiments. (c) morphologic change of MCF10A cells in culture with TGF-β1 after infection of shCDK5-1# or empty vector, Scale bar = 200 μm. (d) immunoblotting analysis of expression of the epithelial marker E-cadherin and the mesenchymal markers N-cadherin and α-SMA in MCF10A cultured without or with TGF-β1 after infection of shCDK5-1# or empty vector. (e) immunofluorescence staining for the epithelial marker E-cadherin and mesenchymal marker N-cadherin. Scale bar = 50 μm.

