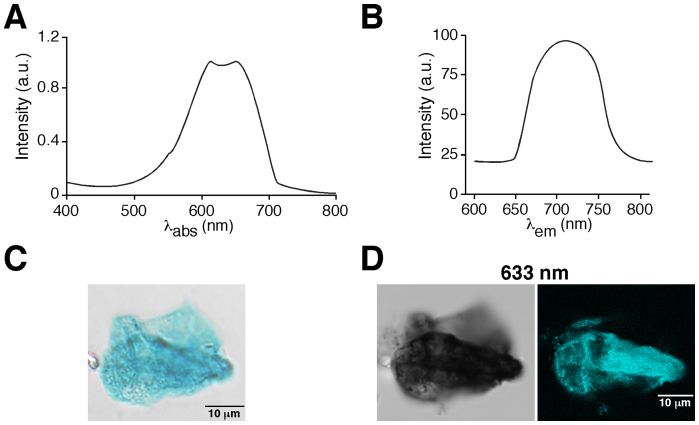
Figure 1. X-gal fluorescence emission after excitation at 633 nm.
(A). Absorption spectrum of X-gal. Note the peak of absorption in the 570–700 nm range. λabs = absorption light wavelength in nanometers. (B). Fluorescence emission spectrum of X-gal after excitation at 633 nm showing fluorescence emission in the 650–770 nm range; a.u: arbitrary units, λem = emitted light wavelength in nanometers. (C). Light microscopy image from purified X-gal precipitate deposited on a coverslip. (D). Images obtained from the same purified X-gal precipitate showed in C visualized by light transmitted microscopy (left panel) and by fluorescence confocal microscopy (right panel) after excitation with a wavelength of 633 nm.

