
Figure 1. Correction factors a and b.
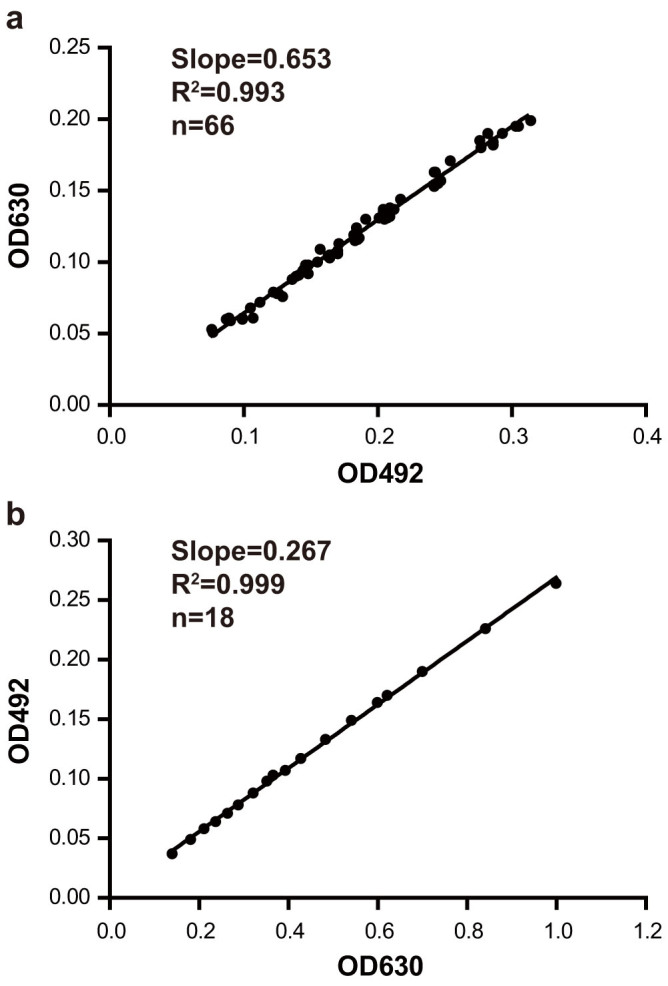
OD630 and OD492 were measured with a series cell density of biosensor A136 (a) and 5,5′-dibromo-4,4′-dichloro-indigo (b). The linear correlation coefficients (R2) were shown in scatter diagrams, and the slopes of the straight lines are the correction factor values a (a) and b (b), respectively. F-Tests were used to fit the best model.