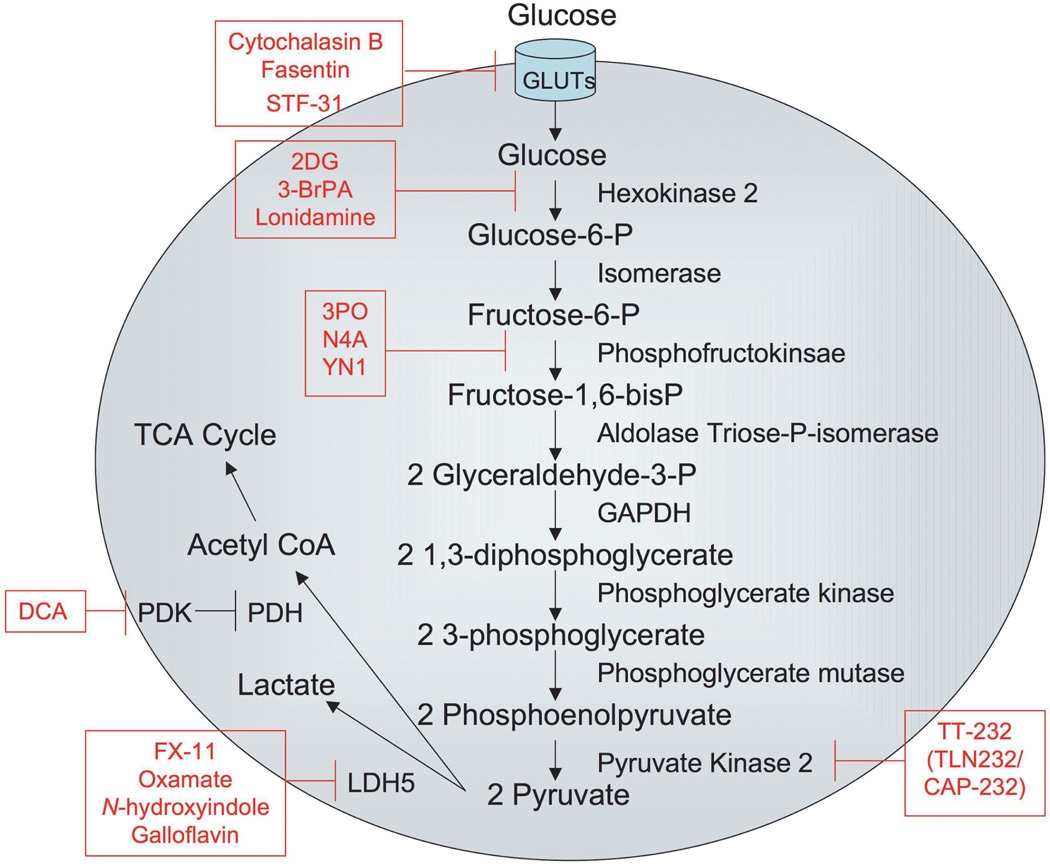
Figure 1. Inhibitors of glucose metabolism.
The figure depicts the glycolytic pathway from glucose entry into cells through production of pyruvate, which is converted either to lactate or to acetyl coA for entry into the TCA cycle. Movement of metabolic intermediates through the pathway is designated by arrows. Enzymes in the glycolytic pathway are placed next to the arrow leading from their substrate to their product. Inhibitors of glycolytic enzymes or glucose transporters appear in boxes.

