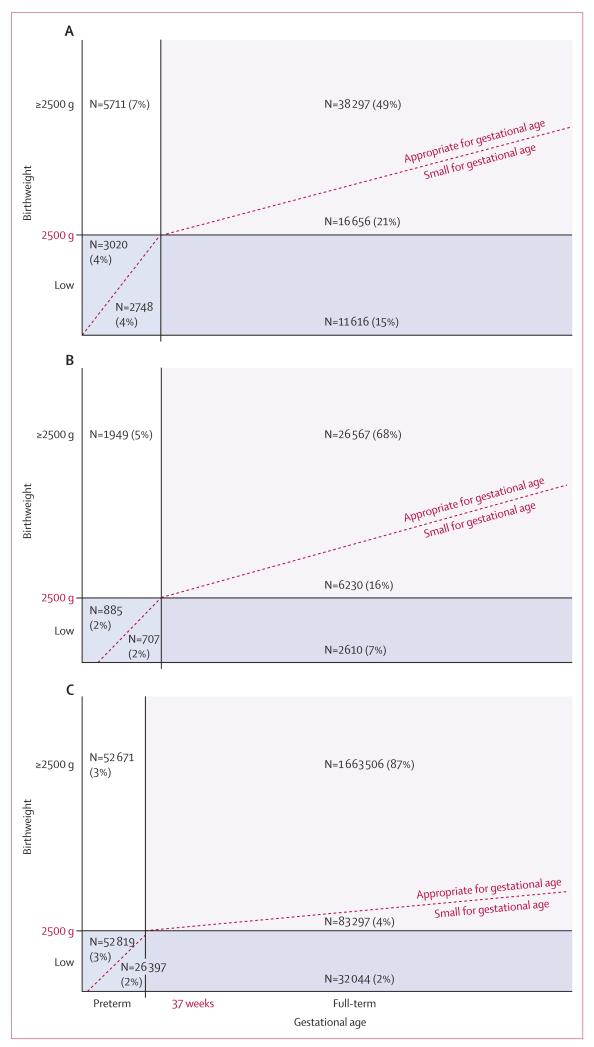
Figure 1. The relation between birthweight and gestational age in Asia (A), Africa (B), and Latin America (C).
For Asian cohorts (A), percentages are for 78 048 infants. For African cohorts (B), percentages are for 38 948 infants. For Latin American cohorts (C), percentages are for 1 910 734 infants.

