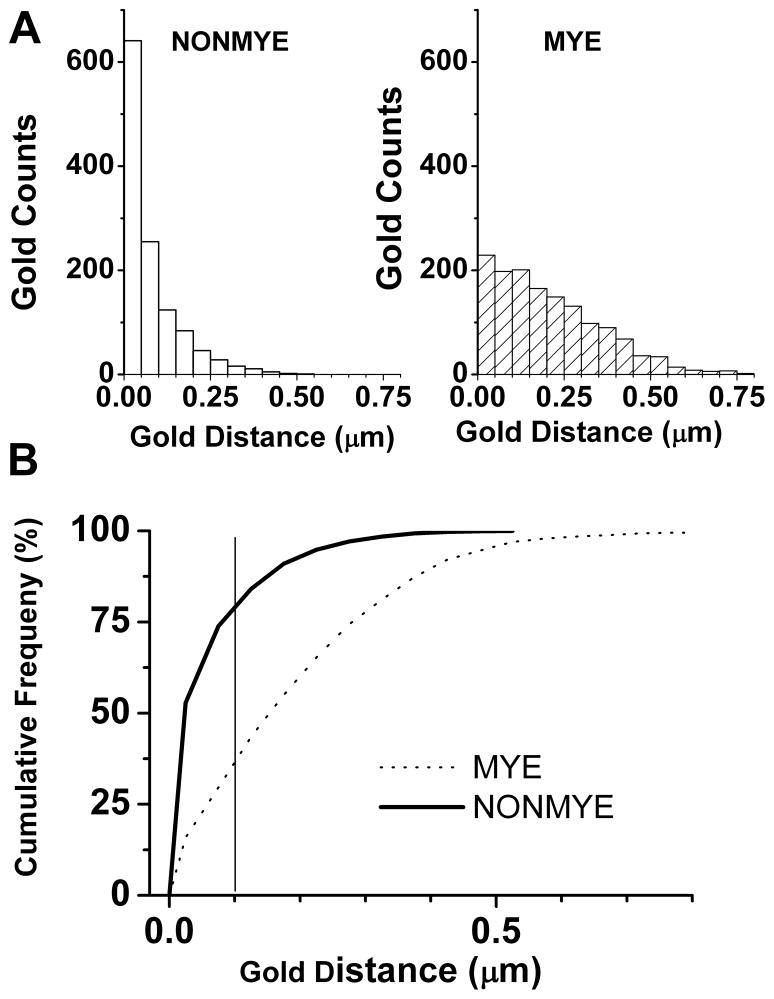
Figure 7. Quantification of CaV3.2 expression in sciatic nerve of mouse using EM.
A) The graphs show distribution of the gold-conjugated CaV3.2 immunoparticles as determined by their distance from axonal membranes in NONMYE (open bars on the left) and MYE (cross-hatched bars on the right).
B) The graph shows cumulative frequency of the distributions of Cav3.2 immunoparticles as determined in experiments depicted on the panels A of this figure. Note that black solid line (NONMYE) is largely shifted to the left when compared to dotted line (MYE) indicating closer association of CaV3.2 with axonal membranes of NONMYE. Solid vertical gray line represents the distance of 0.1 μm from the membrane. For the experiments depicted on this figure we analyzed 41 EM microphotographs and performed a total of 2514 measurements.

