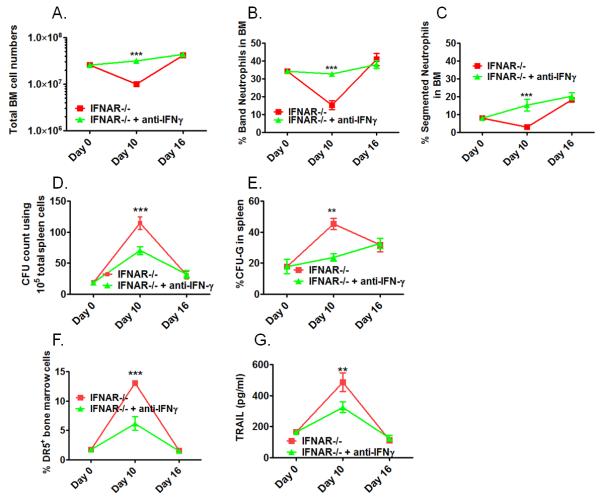
Figure 6. Anti-IFNγ treatment prevents the transient bone marrow crisis in lymphocyte-competent IFNAR−/− mice.
IFNAR−/− mice were infected with Pneumocystis and received either neutralizing anti-IFNγ (3× weekly 250μg, clone R4-6A2) or remained untreated. Bone marrow and spleen responses were analyzed at day 0, 10 and 16 post infections. Shown in Figure 6A-C are comparative analyses of total bone marrow cell numbers (A), and bone marrow cell differentiation with percentage of band neutrophils (B) and segmented neutrophils (C) between treated and untreated IFNAR−/− mice. Figure 6D shows comparative total CFU-counts of spleen cells as a measure of extramedullary hematopoiesis. Figure 6E shows the percentage of G-CFU within total CFUs counted as a measure for extramedullary granulopoiesis. Figure 6 F shows the percentage of TRAIL-receptor (DR5+) bone marrow cells plotted as % positive cells over the course of infection. Figure 6G shows TRAIL-protein levels in bone marrow cell lysates of comparison groups over the course of infection (Figure 6G). Statistical analysis was performed using a 2-way ANOVA. Comparisons were made between the groups at the same time point. P values are marked as * p< 0.05, ** p<0.01, *** p<0.001.

