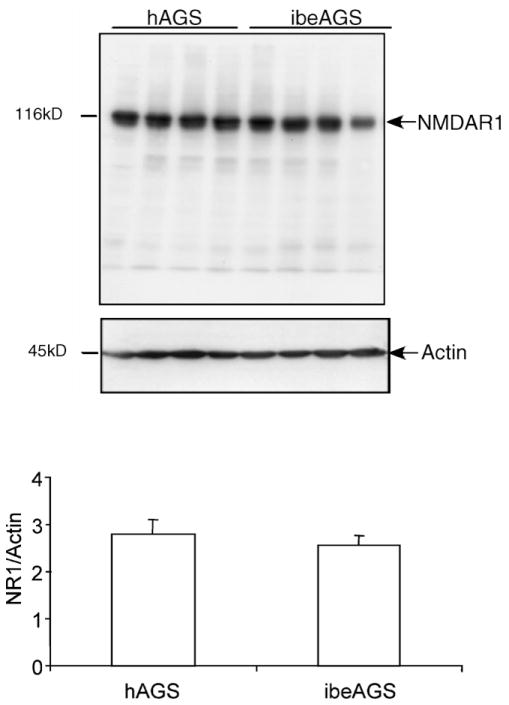
Fig. 6.
NR1 abundance is similar in total protein lysates prepared from hAGS and ibeAGS hippocampi. Immunoblots (top) show representative results of a membrane labeled with anti-NR1 antibody and reprobed with actin as a loading control. Densitometric analysis of NR1 immunoreactivity relative to loading control (bottom graph) shows no difference in NR1 abundance between hAGS and ibeAGS (p > 0.05, n = 4 AGS per group).

