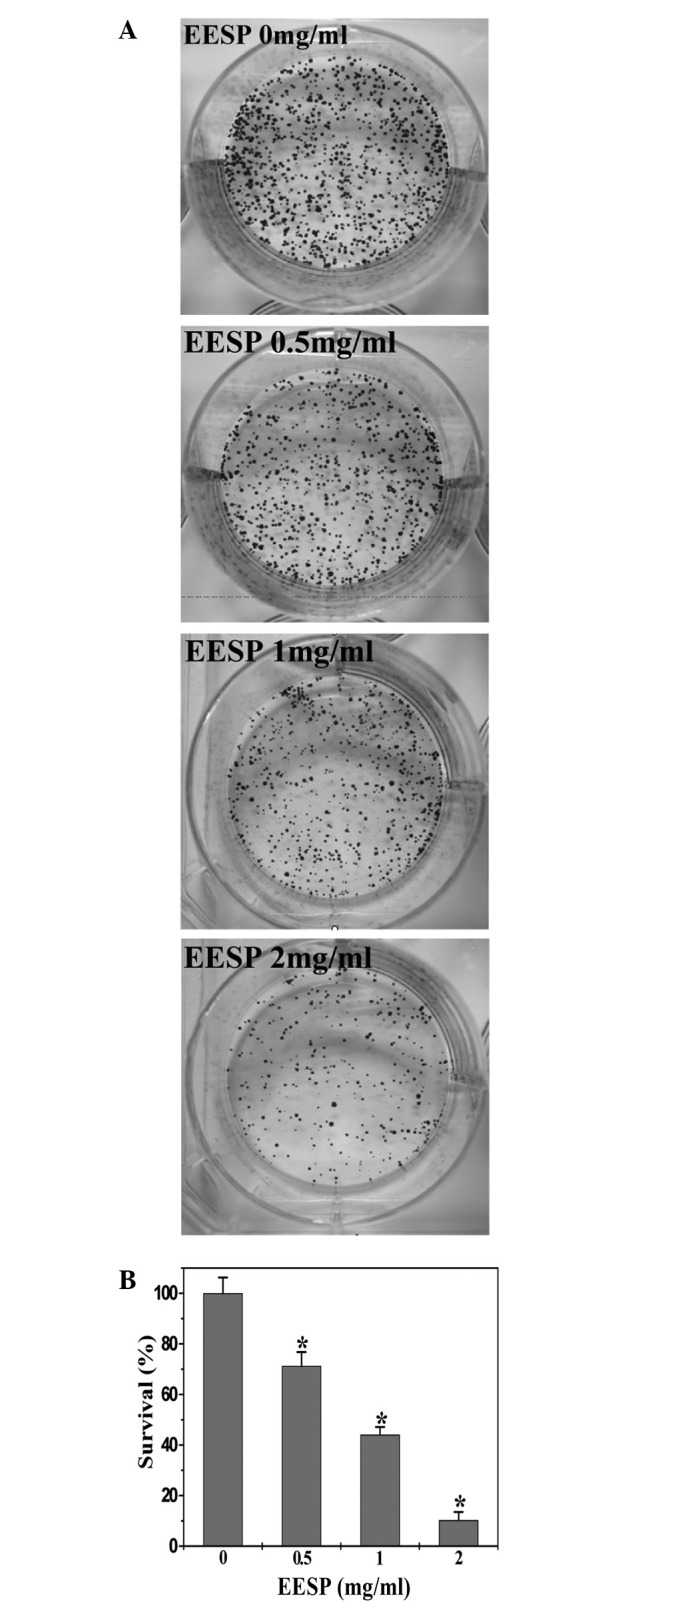
Figure 2.

Effect of EESP on cell survival in HT-29 cells. (A) Cell survival was determined using a colony formation analysis. The images are representative of three independent experiments. (B) The data were normalized to the control cells and are shown as the mean ± SD (error bars) from three independent experiments. *P<0.05, vs. the control cells. EESP, ethanol extract of Spica Prunellae.
