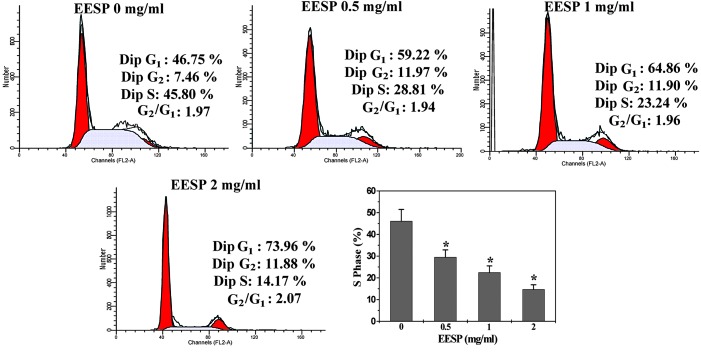
Figure 3.
Effect of EESP on cell cycle progression in HT-29 cells. The cells were treated with the indicated concentrations of EESP for 24 h, stained with PI and analyzed using FACS. The proportion of DNA in the S-phase was calculated using ModfitLT Version 3.0 Software. Data are shown as the mean ± SD (error bars) from three independent experiments. *P<0.05, vs. the control cells. EESP, ethanol extract of Spica Prunellae; PI, propidium iodide; FACS, fluorescence-activated cell sorting.

