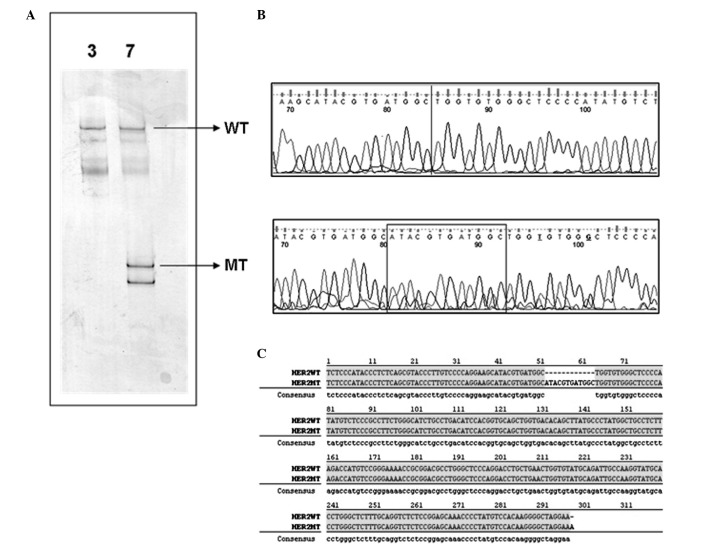
Figure 2.
MSSCP electrophoresis easily differentiates between two genetic variants of HER2. (A) MSSCP electrophoretic profiles of samples 72 (line 3) and 7 (line 7). PCR products of exon 20 HER2 gene amplification were heat denatured and ssDNA was separated on 9% polyacrylamide gel using the MSSCP method under optimal electrophoretic conditions. DNA bands were visualized with silver stain. ssDNA bands corresponding to wild-type (WT) and mutated (MT) sequences are indicated by arrows. (B) Partial DNA chromatograms showing the presence of 12 nucleotide insertions in the DNA sequence obtained from the ssDNA band representing mutated HER2 amplicon (frame). The line in the WT partial DNA chromatogram points to the lack of sequence characteristics for the mutated genetic variant. (C) Sequence alignment of WT and MT HER2 amplicons detected in sample 7. The 12 nucleotide insertion is visible. MSSCP, multi-temperature single-strand conformation polymorphism; ssDNA, single-stranded DNA.

