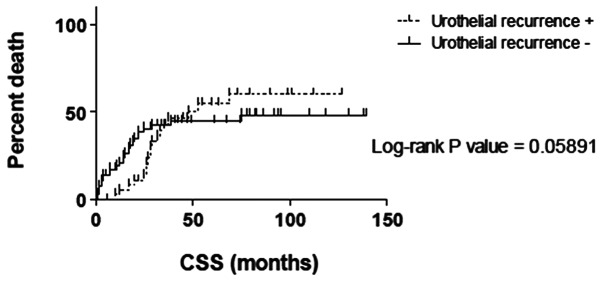
Figure 2.

Kaplan-Meier curves of cancer-specific survival (CSS) time according to the urothelial recurrence categories. Survival curves for the urothelial recurrence-positive (+; broken line) and urothelial recurrence-negative (−; solid line) groups are plotted. The x-axis represents time (months) and the y-axis represents the mortality rate. CSS was defined as being alive or succumbing to causes other than cancer. The time period begins at the time of diagnosis and ends at the time of mortality.
