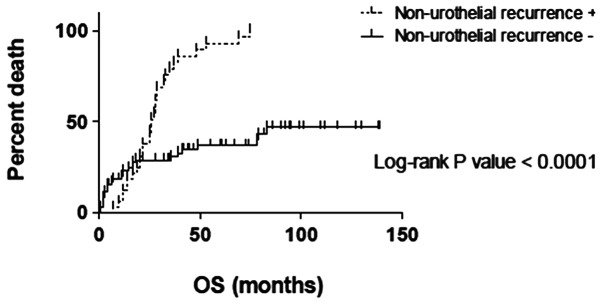
Figure 3.

Kaplan-Meier curves of overall survival (OS) time according to the non-urothelial recurrence categories. Survival curves for the non-urothelial recurrence-postive (+; broken line) and non-urothelial recurrence-negative (−; solid line) groups are plotted. The x-axis represents time (months) and the y-axis represents the mortality rate. Results of the log-rank test indicate that OS is significantly higher in the non-urothelial recurrence-negative group (P<0.0001).
