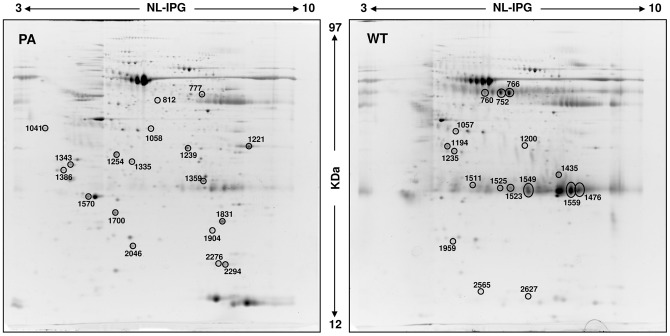
Figure 2. Representative 2D gel maps of PA and WT FNA pool samples.
A total of 250 µg of proteins was separated by 2D using an 18 cm pH 3–10 NL strip and 12.5% SDS-PAGE. Proteins were detected by Ruthenium II tris (bathophenanthroline disulfonate) tetrasodium salt staining. The maps were analyzed by Progenesis Same Spot (Nonlinear Dynamics) software. Spots numbers indicate all the proteins identified by MS/MS and refer to the number reported in Table 2 (PA) and Table 3 (WT).

