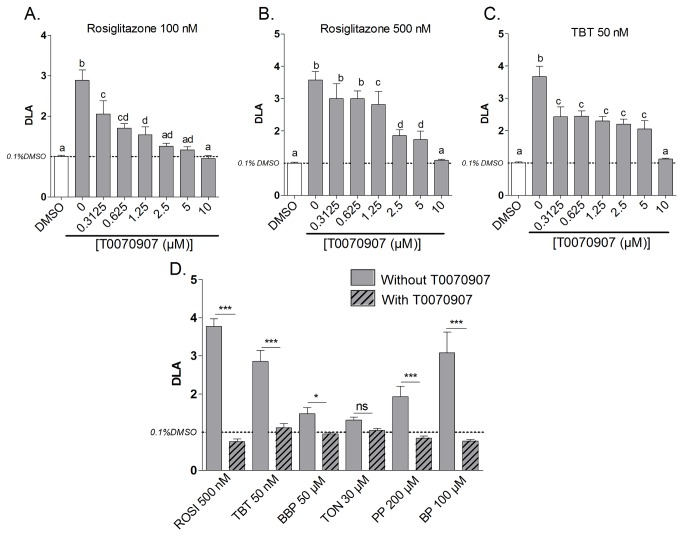
Figure 8. PPARγ dependency of the obesogenic effects of reference and test compounds.
3T3-L1 cells were exposed to Rosiglitazone 100 nM (A), 500 nM (B) TBT 50 nM (C) and screened obesogenic compounds (D) together with a concentration range of the PPARγ antagonist T0070907(A, B, C) or with and without 10 µM T0070907 (D). After 10 days of exposure fluorescent quantification of lipid accumulation was performed using Nile red staining. Data represent the degree of lipid accumulation (DLA) (mean ±SD) of 4 replicates. Significant differences (p≤0.05) between conditions are indicated with different letters for the optimisation tests (A, B, C) and significant differences between screened obesogens with and without T0070907 (D) are indicated with asterisks (*p≤0.05; **p≤0.01; ***p≤0.001) (One Way ANOVA Tukey’s post hoc test).

