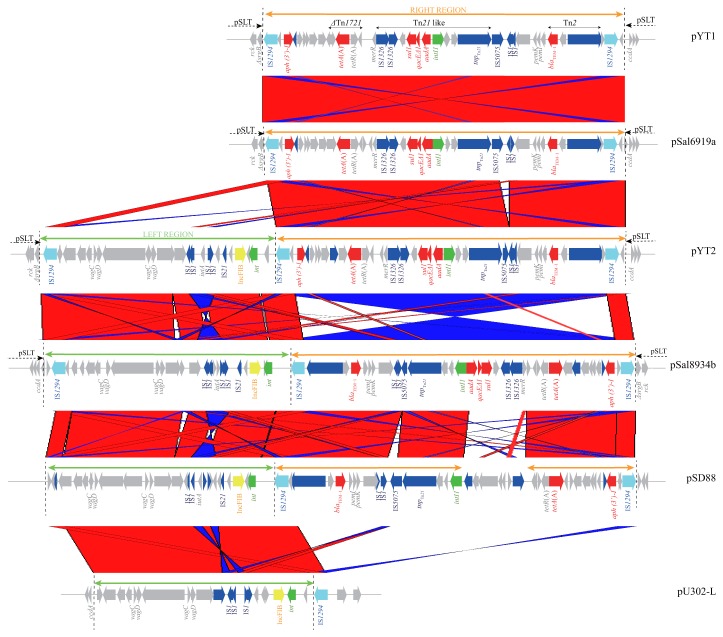
Figure 1. Schematic representation of the inserted segment in pYT1 (GenBank accession number, AB576781) and pYT2 (AB605179) compared with the respective related regions of pSal6919a (JF274991), pSal8934b (JF274992), pSD88 (JF267652), and pU302-L (NC 006816).
Genes encoding antibiotic resistance (red), IS1294 transposase functions (right blue), other transposase functions (navy), replication function (yellow), integrase functions (green), and other functions (gray) are shown. The black double-arrowheads above the diagram indicate mobile elements. The green and orange double-arrowheads above the schemes indicate the left and right region of pYT1 and pYT2, respectively. The regions similar to these are also indicated by the green and orange double-arrowheads above the diagrams. Pair-wise alignment of sequences was performed using a BLASTN similarity search and visualized using the ACT program. The red and blue bars between diagrams represent individual nucleotide matches in the forward or reverse directions, respectively.

