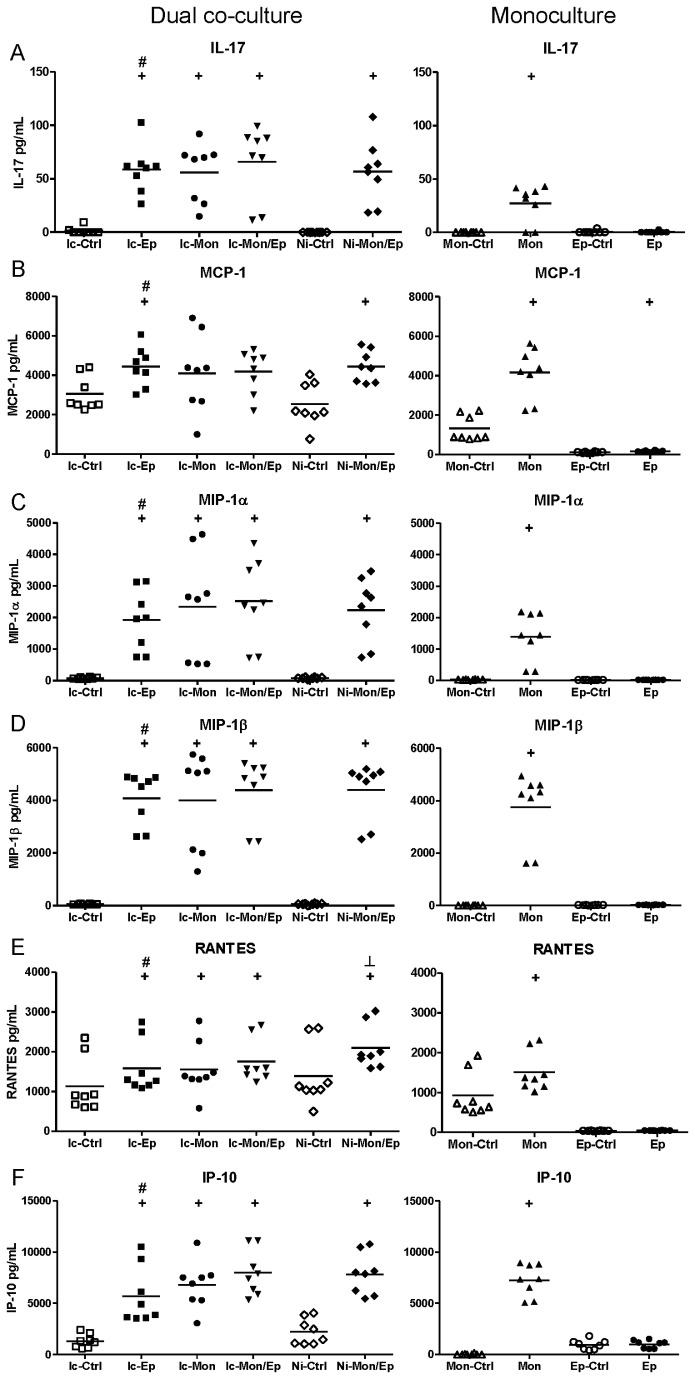
Figure 5. UPEC-induced soluble-dependent biomarker responses in dual co-cultures grouped according to biomarker levels in uroepithelial monocultures.
Experimental Details are as per Figure 4. In this dataset, the most common type of response was a synergistic increase based on a soluble factor(s) conferred by presence of uroepithelial cells. Statistical comparisons are: + control vs corresponding infected; # insert-containing infected co-culture vs corresponding infected monoculture; ┴ insert-containing infected co-culture vs no insert infected co-culture, notations are p < 0.05; Mann–Whitney U-test.

