
Figure 4. Validation of the DNA microarray results by qRT-PCR.
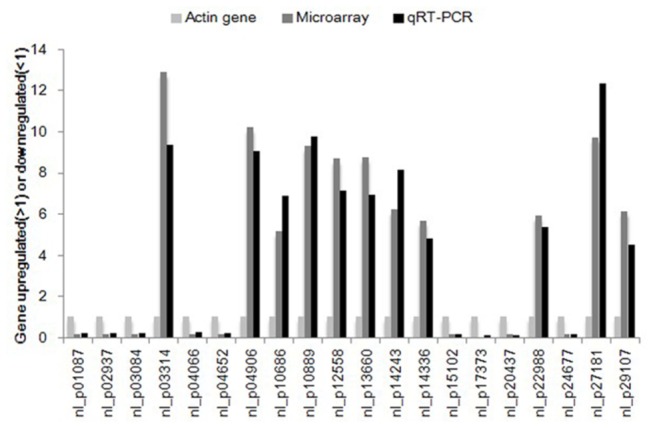
Twenty genes were chosen at random from the highly expressed sequences and their expression levels were assessed by qRT-PCR. The numbers on the horizontal axis represent the probe name in the microarray, while those on the vertical axis are the genes that were upregulated or downregulated.