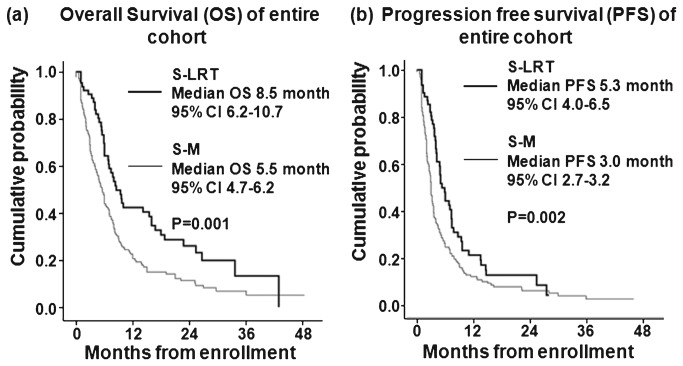
Figure 1. Kaplan-Meier analysis of overall survival (A) and progression-free survival (B) in patients.
Data were stratified by the treatment modalities treated with sorafenib monotherapy (S-M) and sorafenib-based loco-regional treatments (S-LRTs). The thick line indicates S-LRTs and the thin line S-M. Median OS and PFS are significantly longer in S-LRTs than S-M.

