
Figure 1. Analyzing maturation times (MT).
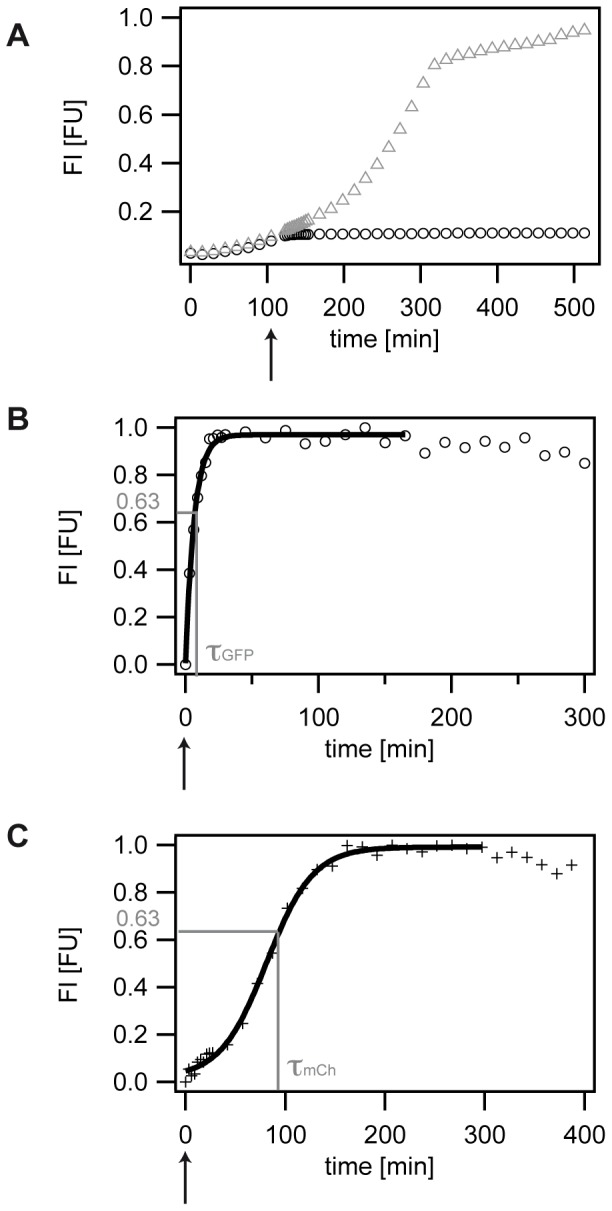
A) Typical data set of fluorescence development of the S strain expressing GFP in the absence (grey triangles) and presence (black circles) of 200 µg/ml CAP. An arrow indicates the addition of CAP after 120 min. B) Typical data set of fluorescence development of the S strain expressing GFP in the presence of 200 µg/ml CAP. The arrow indicates the addition of CAP. Fluorescence development is fitted with an exponential fit, yielding τGFP at normalized 63% FI. The maturation time then corresponds to the inverse of the characteristic time constant τGFP of the exponential fit. C) Typical data set of fluorescence development of the S strain expressing mCh in the presence of 200 µg/ml CAP. The arrow indicates the addition of CAP. Fluorescence development is fitted with a sigmoidal fit, yielding τmCh at normalized 63% FI. The maturation time then corresponds to the inverse of the characteristic time constant τmCh of the sigmoidal fit.