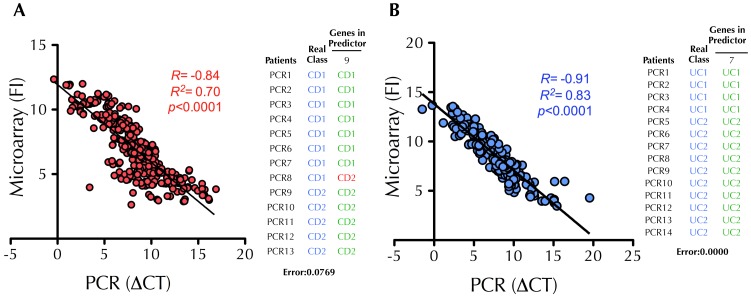
Figure 3. Confirmation of the predictive classifiers of “High” and “low” inflammation subtypes of Crohn’s disease (CD) and ulcerative colitis (UC) by quantitative real time-PCR.
A total of 43 genes (including the predictors) were selected for real time-PCR validation of the microarray data in CD (A) and UC (B). Scatter plots show the correlation between microarray (fluorescence intensity, FI) and PCR (DCt value respect to the endogenous GAPDH, DCt) data, validating microarray results. The tables show the predictions obtained with the selected set of genes obtained from the microarray analysis using the PCR data. For each predictor, patients that were correctly classified are shown in green while those patients where the predictors failed to classify are shown in red. The classification accuracy obtained with PCR data was the same as the one obtained with the microarray data.

