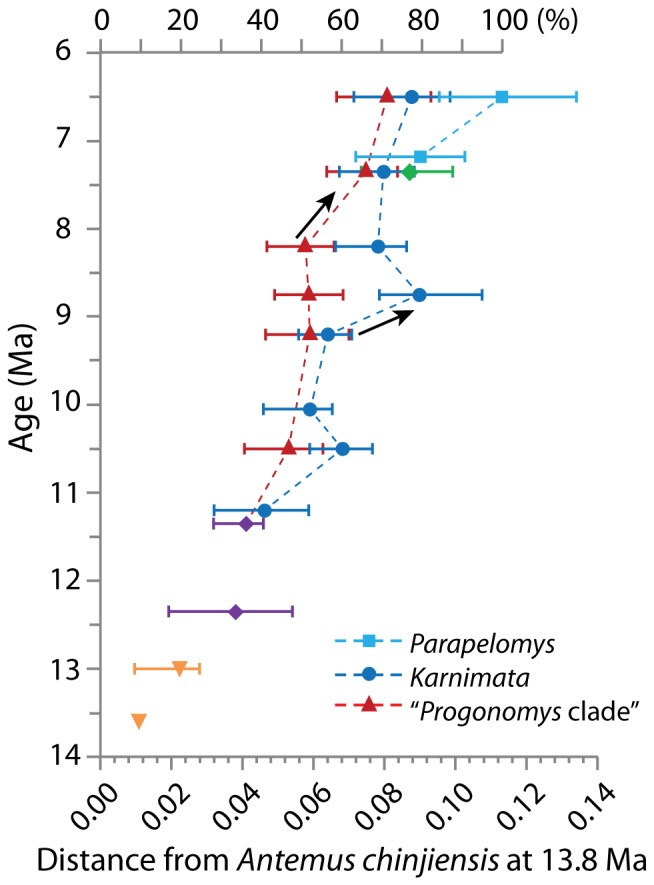
Figure 7. Euclidean distances from Antemus chinjiensis at 13.8.

Ma to each species, using 10 principal components. The percentage on the top of the ordinate axis is expressed as a percentage of morphological change as A. chinjiensis at 13.8 Ma is set to be 0%, and P. robertsi is set to be 100%. Symbols as in Figure 2. Combined ages: 13.7 to 13.6 Ma for A. chinjiensis at 13.6 Ma, 13.2 to 12.8 Ma for A. chinjiensis at 13.0 Ma, 11.6 to 11.2 Ma for P. hussaini, 10.5 to 10.1 Ma for Progonomys sp. at 10.5 Ma, 9.4 to 9.0 Ma for K. darwini, 9.2 to 9.0 Ma for P. debruijni, 8.0 to 7.1 Ma for Parapelomys sp. at 7.2 Ma.
