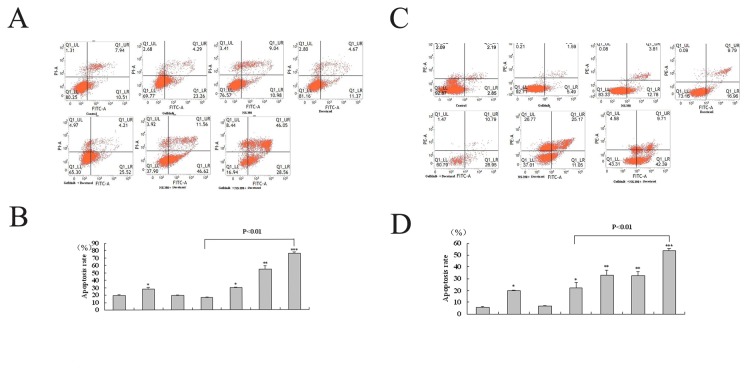
Figure 4. FACS analyses of apoptosis induction effect induced by docetaxel (D, 0.01 μmol/L), NS-398 (N, 100μmol/L) and gefitinib (G, 20μmol/L) alone or in combination following 24 h incubation with PC-3M (A and C) and DU-145 cells (B and D).
After incubation with various drugs, the cells were prepared as described in Materials and Methods and apoptotic rate was assessed by FACS analyses. A and C: Representative dot plots illustrate the data near the mean of groups in B and D. B and D. Apoptosis rate was calculated from UR (non-viable apoptotic or necrosis cell rate) and LR (early apoptotic cell rate) association. Representative results from three separate experiments. *P <0.05, ** P <0.005 ***, P <0.001 compared with control values.

