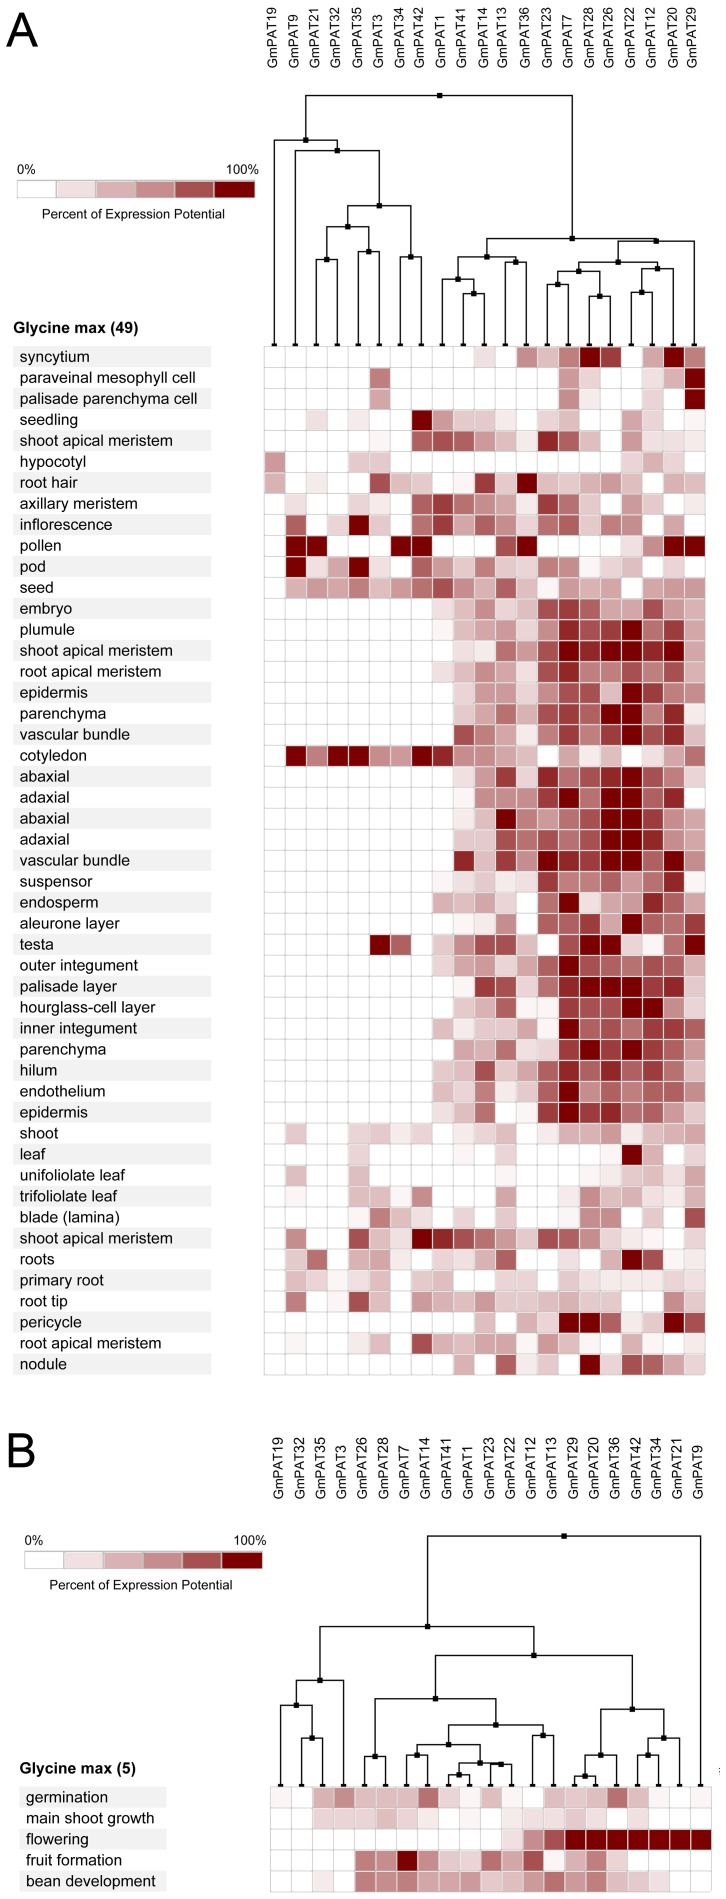
Figure 11. Expression analysis of GmPATs genes in Glycine max.
The heatmap was prepared using the Genevestigator tool, and the microarray expression data were from the results of many chips available on the web (https://www.genevestigator.com/gv/). The dark and light colour shadings represent relatively high or low expression levels, respectively. (A)Expression analysis of GmPATs genes in different tissues (B)Expression analysis of GmPATs genes in different life stages

