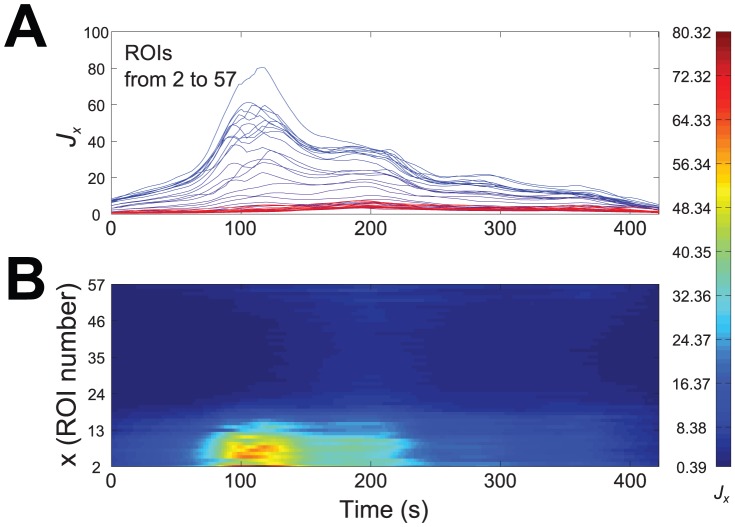
Figure 4. Activity index  computed for all ROIs.
A: trends of  for all ROIs, superimposed according to a color gradient from blue (growth cone) to red (soma). B: two-dimensional map of
  . The horizontal and vertical axes are, respectively, time (
 ) and space (
 ) coordinates, while values of
  are coded by colors, from blue (low) to red (high).

