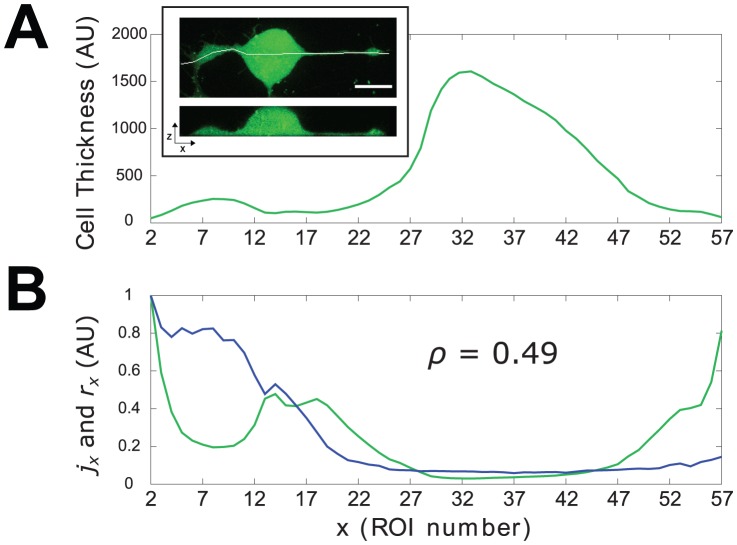
Figure 6. Cellular thickness and surface to volume ratio compared with oscillatory activity in space.
A: profile of the thickness of the cell as derived with the procedure outlined in “urface to Volume Ratio Assessment” subsection. Inset: confocal image of a CG neuron cultured for  h in N2 medium and loaded for
  min with the fluorescent probe Fluo4-AM. Upper panel:
  image reconstructed from XYZ scan; lower panel: virtual section along the horizontal white line in the upper panel. B: traces of the normalized activity index
  (blue trace) and surface to volume ratio
  (green trace) along the cell.
  is the value of the correlation coefficient computed over the entire cell (global
  ).
).

