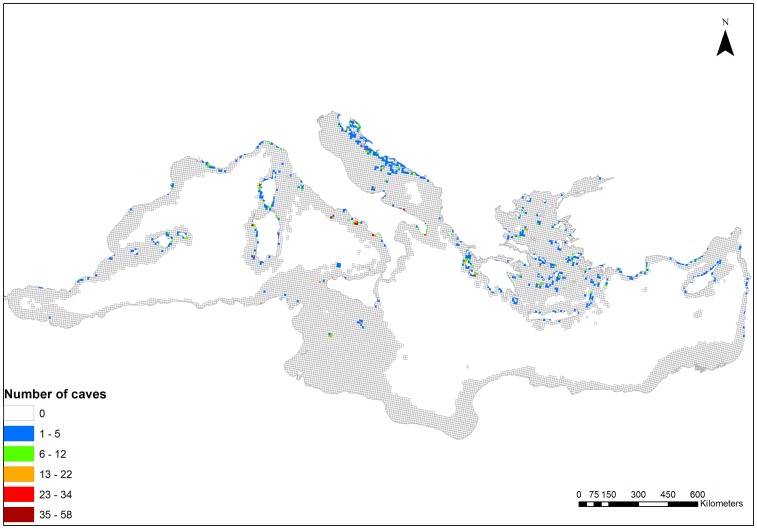
Figure 4. Distribution of marine caves in the Mediterranean Sea.
Different colours indicate the variation in cave number per planning unit, warmer colours illustrating planning units with higher number of caves. Information on the spatial distribution of marine caves was extracted from various sources which are provided as a supplementary material.

