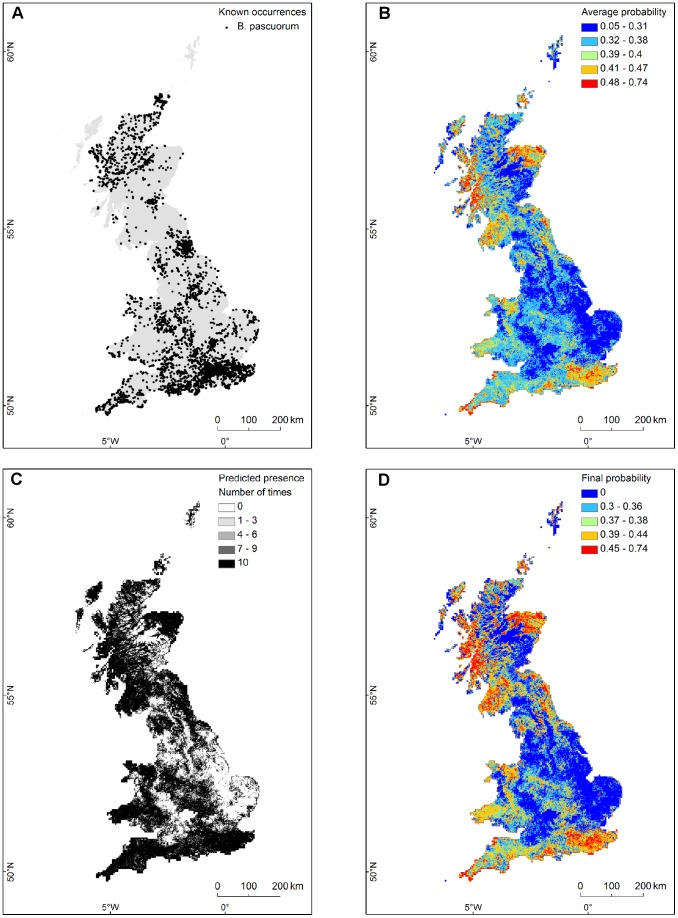
Figure 3. SDM outputs for Bombus pascuorum.
Outputs from the SDM for B. pascuorum: (A): known occurrences; (B): predicted MaxEnt average probability from the 10-fold cross-validation models, using geometric interval classes from blue to red; (C): summed presence from the 10 binary maps (10 indicates areas where all 10 models predicted presence and 0 areas where all models predicted absence); (D): final predicted probability for B. pascuorum used as input for the pollinator service, derived from assigning the average probability values in (C) only to the areas where all models predicted presence, and 0 to any area predicted “absence” by at least one binary map. Map projection: British National Grid (BNG).

